How to Plot a Mathematical Function in Python
In this tutorial, I'll show you how to plot one or more mathematical functions in Python using the Matplotlib and Numpy libraries.
First, let's import the necessary libraries, Matplotlib and Numpy.
import matplotlib.pyplot as plt
import numpy as np
Next, we define the equations for a line and several parabolas.
def line(x):
return -x + 2
def parabola1(x):
return x**2 - 3*x + 3
def parabola2(x):
return -x**2 + x + 1
def parabola3(x):
return 2*x**2 - 5*x + 4
We then create a range of x values.
x = np.linspace(-2, 3, 400)
Next, we compute the corresponding y values for each function.
y_line = line(x)
y_parabola1 = parabola1(x)
y_parabola2 = parabola2(x)
y_parabola3 = parabola3(x)
Now, let's plot these functions.
plt.figure(figsize=(10, 6))
plt.plot(x, y_line, label='y = -x + 2', color='red')
plt.plot(x, y_parabola1, label='y = x^2 - 3x + 3', color='blue')
plt.plot(x, y_parabola2, label='y = -x^2 + x + 1', color='green')
plt.plot(x, y_parabola3, label='y = 2x^2 - 5x + 4', color='purple')
We'll highlight the point T(1, 1).
plt.scatter(1, 1, color='black', zorder=5)
plt.text(1, 1, ' T(1, 1)', verticalalignment='bottom', horizontalalignment='right')
Let's add a legend and label the axes.
plt.legend()
We label the x and y axes.
plt.xlabel('x')
plt.ylabel('y')
We'll also add a title to the graph.
plt.title('Set of Parabolas Tangent to the Line y = -x + 2 at Point T(1, 1)')
To make the graph clearer, we'll add a grid.
plt.grid(True)
plt.axhline(0, color='black', linewidth=0.5)
plt.axvline(0, color='black', linewidth=0.5)
Finally, we display the plot.
plt.show()
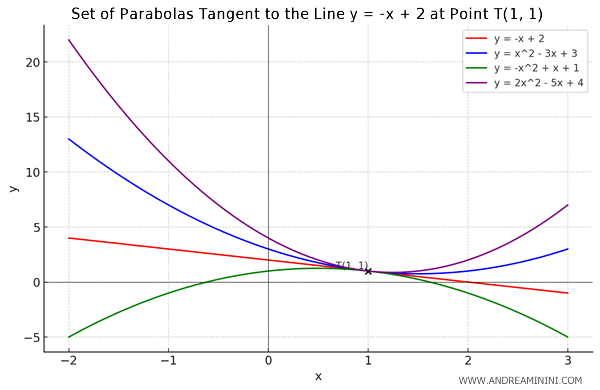
The result is a graph showing the behavior of these functions over the specified range.

In this case, the graph shows a set of parabolas tangent to a line at point T.
And there you have it.
