Mode in Statistics
What is the Mode?
In statistics, the mode of a distribution X is the value that occurs most frequently; in other words, the one with the highest frequency.
The mode is also known as the normal value, modal value, or norm. Essentially, it indicates the most common value within the distribution.
For example, in this table, the mode is the grade "discrete" because it has the highest frequency (14).
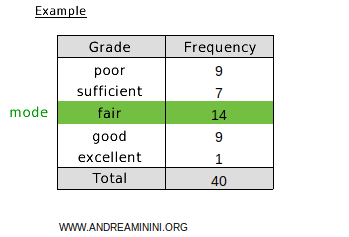
The mode is one of the measures of central tendency in a distribution, along with the mean and median.
Note. A distribution can have one, none, or multiple modes, and is classified as:
- unimodal if it has a single mode
- bimodal if it has two modes
- multimodal if it has more than two modes
- zeromodal if it has no mode
The Modal Class
You can also find the mode in frequency distributions, where values are grouped into classes.
In a frequency distribution, the mode is the class with the highest frequency, referred to as the modal class.
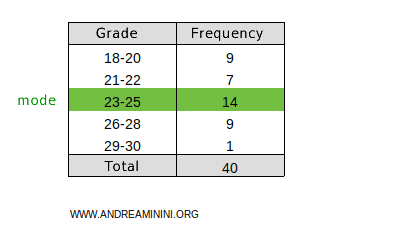
For example, in this table, the class 23-25 is the modal class because it has the highest frequency (14) among all classes.
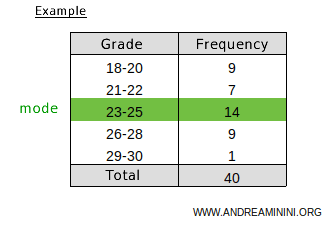
If the classes have varying widths, it's better to divide the frequency by the class width to identify the mode.
The ratio of frequency to class width is called frequency density.
The modal class is the one with the highest frequency density.
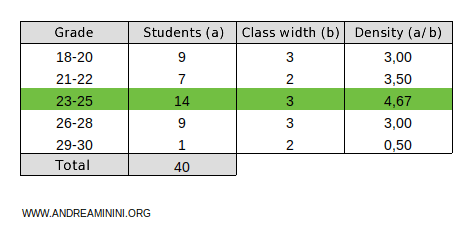
Explanation. For instance, the class 23-25 has a width of 3 because it includes the values 23, 24, and 25, and its frequency is 14. Thus, the frequency-to-width ratio (frequency density) is 14/3 = 4.67. This is the highest ratio among all the classes, making 23-25 the modal class.
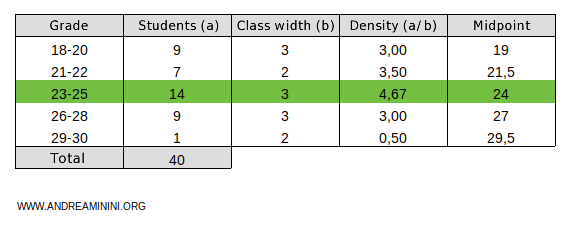
To find the modal value of the modal class, you can use linear interpolation or simply take the midpoint of the class.
For example, the midpoint of the modal class 23-25 is 24. Therefore, the modal value is 24.
To identify the modal class:
- If all classes have the same width, the modal class is the one with the highest frequency.
- If the classes have different widths, the modal class is the one with the highest frequency density, i.e., the greatest frequency-to-width ratio.
A Practical Example
Consider the distribution
$$ X = \{ 1,2,5,2,6,7,3,3,2 \} $$
The number 2 appears three times in the distribution.
It is the most frequently occurring value.
$$ X = \{ 1, \color{red}2,5,\color{red}2,6,7,3,3,\color{red}2 \} $$
Therefore, the mode of the distribution is 2.
$$ \mu_o = 2 $$
Since there is only one mode, the distribution is unimodal.
Example 2
Consider the distribution
$$ X = \{ 1,2,3,4,5,6,7,8,9 \} $$
In this case, the distribution has no mode because all values have the same frequency of one.
This is an example of a zeromodal distribution.
Example 3
Consider the frequency distribution
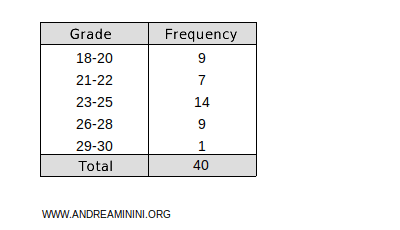
Here, the mode is the class 23-25, as it has the highest frequency (14).
Key Points
Some important points about the mode:
- The mode is the only measure of central tendency that can be calculated for non-ordinal qualitative distributions, as well as for quantitative ones.
Example. This distribution contains non-ordinal qualitative values. Since colors are a non-ordinal quality, it's not possible to calculate the mean or median.
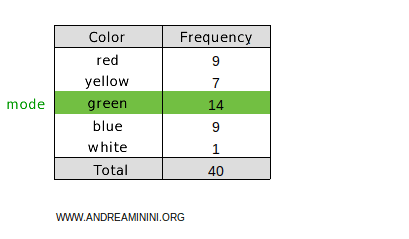
However, the mode can still be determined. The mode of this distribution is the class with the highest frequency (14), which is the green class. - In continuous-scale distributions, the mode is the value x at which the density f(x) reaches its maximum.
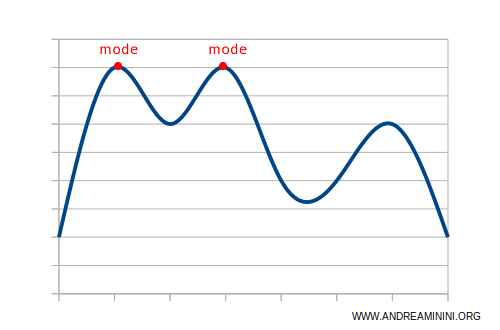
- On a distribution curve, the mode is represented by the peak. If the distribution is unimodal, it has a single peak. If it’s multimodal, there are multiple peaks.
- In a normal (unimodal and symmetric) frequency distribution curve, the mode, mean, and median are equal.
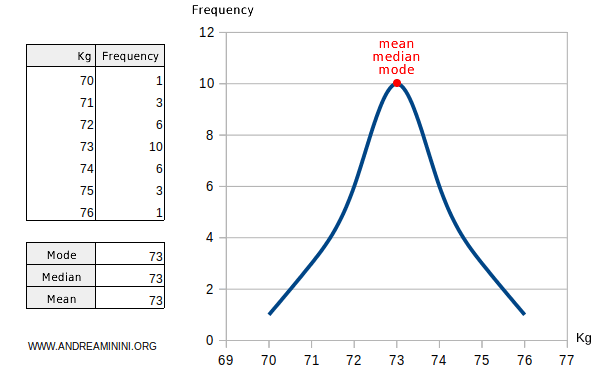
Another Example. Consider a simple symmetric distribution of n=9 values: $$ X = \{\ 1,2,3,4,4,4,5,6,7 \}$$ The mode is 4, as it occurs most frequently: $$ \mu_o=4 $$ The arithmetic mean is also 4: $$ \mu = \frac{1+2+3+4+4+4+5+6+7}{9} = \frac{36}{9} = 4 $$ Lastly, the median is also 4: $$ \mu_e = 4 $$ Thus, all three measures coincide.
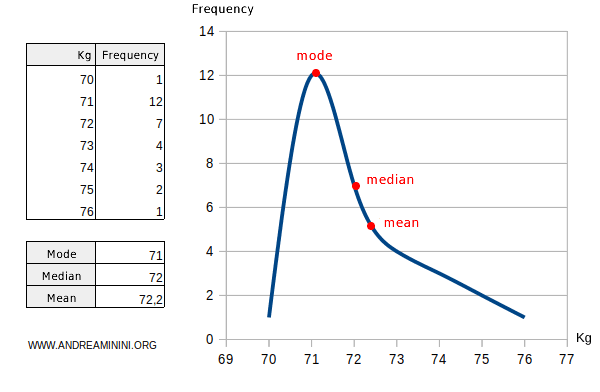
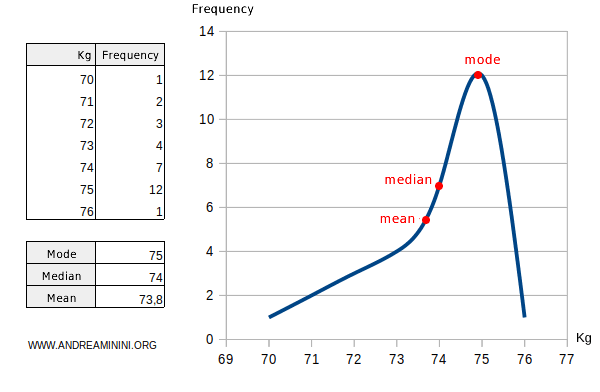
- If the distribution is skewed, the mode, mean, and median will differ.
- If the distribution is left-skewed, the mode is less than the median, which is less than the mean: $$ \mu_o < \mu_e < \mu $$ Example
- If the distribution is right-skewed, the mode is greater than the median, which is greater than the mean: $$ \mu < \mu_e < \mu_o $$ Example
- If the distribution is left-skewed, the mode is less than the median, which is less than the mean: $$ \mu_o < \mu_e < \mu $$ Example
And so on.
