Statistics
Statistics is the science of learning from data. It encompasses the collection, description, summarization, and analysis of data.
Statistical analysis plays a crucial role in informed decision-making.
Statistics is divided into two main branches:
- Descriptive Statistics
Descriptive statistics involves gathering, describing, illustrating, and summarizing data, with a focus on presenting the collected data clearly. - Inferential Statistics
Inferential statistics, or statistical inference, examines the characteristics of a population under conditions of uncertainty by observing a representative sample and calculating probabilities. Its goal is to draw conclusions about the entire population.
Probability Theory
This branch of statistics deals with the study of random phenomena and the management of uncertainty.
Why Is It Called Statistics?
The word "statistics" originates from the term "state" because the earliest attempts to collect data were made by states in the 15th and 16th centuries.
Notably, the Church played a significant role, recording births, marriages, and deaths in parish registers.
These census records were particularly valuable for the administration and governance of states.
Example: By aggregating parish census records, authorities could gather crucial information for organizing tax collection, assembling military forces, assessing public health, and evaluating the risks of food shortages or epidemics.
Initially, statistics was primarily concerned with describing the state of a population at a specific point in time.
However, starting in the 19th century, statistics evolved into a science of data analysis in a broader and more abstract sense, with applications across various disciplines, including science, society, and economics.
The Stages of the Statistical Process
The statistical process can be broken down into several key stages:
- Data Collection
Sometimes, data is already available within an organization (such as a government or company). Other times, the analyst must design and conduct a data collection process. - Data Description
This involves presenting the data in a clear and comprehensible manner. - Data Summarization
This step involves distilling large volumes of data into concise, aggregated figures. - Data Analysis
Statistical analysis evaluates the effectiveness of research methods and extracts meaningful insights from the data.
Note: Grouping and summarizing data may lead to some loss of detail, but it greatly enhances the data's readability and interpretability. As such, these steps are closely tied to the specific goals you aim to achieve.
The Concept of a Statistical Population
One of the fundamental concepts in statistics is the notion of a population.
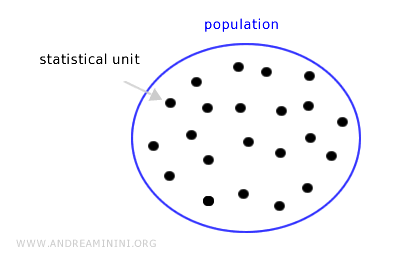
A population (or universe) is a set of entities from which information is derived.
Here, "entity" refers to anything, whether abstract or concrete, that belongs to a set referred to as a "population."
This could be a collection of tangible objects (such as bolts produced by a factory) or a group of people.
Each individual entity within the population is known as a statistical unit.

The units in a population can be characterized by various attributes.
Example: Attributes of a population might include height, weight, hair color, or engine displacement in cars.
Every characteristic can be described using modalities.
Based on these modalities, characteristics are classified into two types:
- Qualitative Characteristics
These characteristics represent attributes or qualities that cannot be measured numerically. They describe features using words (e.g., gender, marital status).Example: A person's hair color can be black, blonde, brown, red, etc. Hair color is a characteristic that cannot be quantified with numbers. The possible modalities are the different hair colors (e.g., black, blonde, brown). Gender (male, female) is another example of a qualitative characteristic, with its modalities being male and female.
- Quantitative Characteristics
These characteristics represent measurable quantities that can be expressed numerically. Quantitative characteristics are further divided into:- Discrete: These are characteristics that can take on a finite number of values or a countable infinite number of values. For example, the number of children is a discrete characteristic because it can be expressed with whole numbers: 0, 1, 2, 3, etc. Even though whole numbers are infinite, they are considered countably infinite.
- Continuous: These are characteristics that can assume an infinite number of values within a real interval (e.g., height, weight, prices, etc.).
Example: Height is measured in units such as 175 cm, 176 cm, and so on. It is a continuous quantitative characteristic because there are infinitely many possible values between any two measurements. For instance, between 175 cm and 176 cm, there exist countless intermediate heights (175.5 cm, 175.25 cm, 175.9999 cm, etc.). Some quantitative characteristics can also express intensity, such as the seasonal rainfall in a specific location.
Types of Statistical Analysis
Statistical analysis of a population can be conducted in two primary ways:
- Census
This method involves analyzing every entity within the population, known as a census. - Sample Analysis
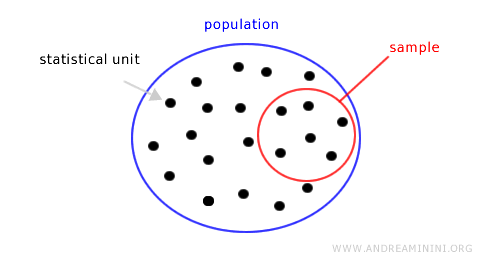
In this approach, the analysis is carried out on a subset of the population, known as a sample.

Sample analysis offers two main advantages: it is more cost-effective and faster.
However, to be effective, the sample must accurately represent the population and contain the same information.
Example: In a city of 100,000 residents of various ages, a survey is conducted on a sample of 1,000 people. The sample must be representative of the population, meaning it should reflect the same distribution of age, income levels, education, and so on. If the sample is not representative, the analysis would only reflect the opinions of the 1,000 surveyed individuals, not the entire 100,000.
Unfortunately, finding a truly representative sample is not always easy.
Often, the criteria for selecting a sample can be flawed or subjective, leading to a sample that does not accurately represent the population.
In such cases, a random sampling approach may be the most appropriate.
And so on.
