Measures of Variability in Statistics
Measures of variability assess the spread and disparity of data within a statistical distribution.
Data variability can be understood from two different perspectives:
- Dispersion refers to how tightly or loosely the values cluster around a central value, such as xM (or another reference point). It can be measured by the average deviation of values from the central point, expressed as xi-xM.
- Inequality focuses on the differences between data points. This is quantified by calculating the absolute differences |xi-xj| between every pair of values in the population.
Note: Measures of variability are often used in statistics to compare two or more distributions or populations. For instance, if two groups, A and B, have the same mean but group B has less dispersion, it indicates that the values in group B are more concentrated around the mean compared to those in group A.
The Purpose of Variability Measures
When using a measure of central tendency (such as the arithmetic mean), you get a summary of the distribution, but much of the detail is lost.
One of the key pieces of information that gets lost is the variability of the data.
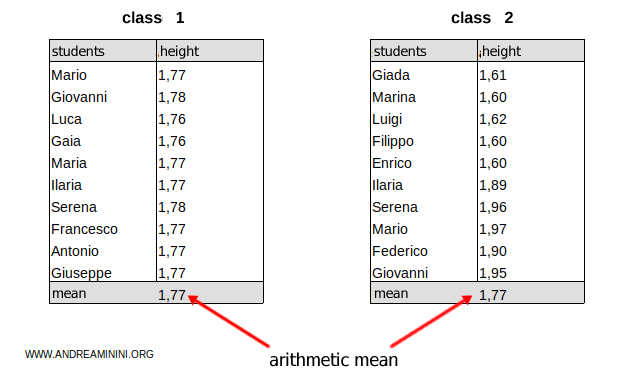
For example, let’s take two groups of students and measure their height.

In both cases, the arithmetic mean is 1.77 cm, but the two groups are not statistically the same.
$$ \mu=1.77 \ cm $$
The mean is a summary measure, but it tells us nothing about the spread of the data.
- In the first group (class 1), the students' heights are all close to the mean (1.77 cm).
- In the second group (class 2), the students' heights vary widely from the mean (1.77 cm).
For this reason, it’s useful to complement a central tendency measure with a measure of variability.
Types of Variability Measures
There are two main types of variability measures:
- Absolute measures of variability
These measures depend on the unit of measurement. Examples include variance or standard deviation.- Range
The range measures the difference between the maximum and minimum values in a distribution. - Interquartile range
This measures the difference Q3-Q1 between the third quartile (Q3) and the first quartile (Q1) in a distribution.
Semi-interquartile range
This measures half of the interquartile range. - Average absolute deviation
This sums the absolute differences from the mean or median. - Variance
Variance measures statistical dispersion. - Sample variance
This measures the statistical dispersion of a population using a sample. - Standard deviation
Standard deviation is the square root of variance. - Sample standard deviation
This is the square root of the sample variance. - Deviance
Deviance is another measure of statistical dispersion. - Mean difference
This calculates the average distance between all pairs of values in a distribution.
- Range
- Relative measures of variability
These measures are not affected by the unit of measurement and are particularly useful for comparing the variability of different phenomena.- Coefficient of variation
The coefficient of variation measures the relative variability of one or more distributions. - Concentration
This measures the degree of concentration within a distribution. - Standardized variables
It allows for the comparison of variables with different natures.
- Coefficient of variation
And so on.
