Sample standard deviation
The sample standard deviation measures the spread of a population around its mean, based on the standard deviation calculated from a random sample. $$ \sigma = \sqrt{ \frac{1}{n-1} \cdot \sum_{i=1}^n (x_i-\mu)^2 } $$ Here, n represents the number of elements in the sample, and μ is the sample mean.
It is the square root of the sample variance.
What is it used for?
The sample standard deviation formula is used when calculating the standard deviation of an entire population is impractical due to technical or financial limitations.
This might happen, for instance, if the statistical analysis requires destroying the sample, or when the population is too large to survey completely.
How does it differ from the standard deviation? The standard deviation, or mean squared deviation, includes all n elements of the population in the denominator: $$ \sigma = \sqrt{ \frac{1}{n} \cdot \sum_{i=1}^n (x_i-\mu)^2 } $$ However, for the sample standard deviation, the formula adjusts for the smaller sample size by using n-1 in the denominator. In this case, n refers to the number of elements in the sample. This adjustment is necessary because a smaller sample tends to underestimate the population’s actual standard deviation. $$ \sigma = \sqrt{ \frac{1}{n-1} \cdot \sum_{i=1}^n (x_i-\mu)^2 } $$
A practical example
Imagine a school with a population of 1000 students.
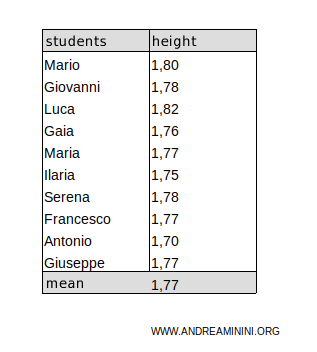
Instead of measuring every student, I estimate the average height and standard deviation from a sample of 10 students.

The average height in the sample is 1.77 cm.
$$ \mu = 1.77 $$
Since the sample contains n=10 students, I can calculate the sample standard deviation:
$$ \sigma = \sqrt{ \frac{1}{n-1} \cdot \sum_{i=1}^n (x_i-\mu)^2 } $$
$$ \sigma = \sqrt{ \frac{1}{10-1} \cdot \sum_{i=1}^n (x_i - 1.77)^2 } $$
$$ \sigma = \sqrt{ \frac{1}{9} \cdot [ ( 1.80-1.77)^2+( 1.78-1.77)^2+( 1.82-1.77)^2+ ( 1.76-1.77)^2+ \\ \ \ \ \ +( 1.77-1.77)^2+( 1.75-1.77)^2+( 1.78-1.77)^2+ \\ \ \ \ \ + ( 1.77-1.77)^2+( 1.70-1.77)^2+( 1.77-1.77)^2 ] } $$
$$ \sigma = \sqrt{ \frac{1}{9} \cdot [ ( 0.03)^2+( 0.01)^2+( 0.05)^2+( 0.01)^2+( 0)^2+ \\ \ \ \ \ +( -0.02)^2+( 0.01)^2+( 0)^2+( -0.07)^2+(0)^2 ] } $$
$$ \sigma = \sqrt{ \frac{1}{9} \cdot [ 0.0009+ 0.0001+0.0025+0.0001+0.0004+0.0001+0.0049 ] } $$
$$ \sigma = \sqrt{ \frac{1}{9} \cdot 0.009 } $$
$$ \sigma = \sqrt{ 0.001 } $$
So, the sample standard deviation is σ = 0.0316.
$$ \sigma = 0.316 $$
In this way, I can estimate the standard deviation for the entire population of 1000 students based on the sample data.
Note: If I had used the formula for the population standard deviation, the result would have been lower. $$ \sigma = \sqrt{ \frac{1}{n} \cdot \sum_{i=1}^n (x_i-\mu)^2 } = \sqrt{ \frac{1}{10} \cdot 0.009 } = 0.03 $$ This is why the sample standard deviation is corrected by using a smaller denominator (n-1). $$ \sigma = \sqrt{ \frac{1}{n-1} \cdot \sum_{i=1}^n (x_i-\mu)^2 } = \sqrt{ \frac{1}{9} \cdot 0.009 } = 0.0316 $$
And so on.
