Mean difference in statistics
The mean absolute difference is a measure of variability based on the absolute differences between every pair of elements in a distribution. $$ \Delta = \frac{1}{n \cdot (n-1)} \cdot \sum_{i=1}^n \sum_{j=1}^n |x_i - x_j| $$ where n is the number of elements in the distribution.
Absolute values are used for the differences to avoid cancellation, as opposite values (e.g., 2 and -2) would otherwise offset each other.
The denominator of the mean absolute difference represents the number of possible pairings, n(n-1), excluding comparisons of an element with itself, which are not relevant here.
Note. If you wish to include comparisons of elements with themselves, you should use the formula for the mean difference with repetition: $$ \Delta = \frac{1}{n^2} \cdot \sum_{i=1}^n \sum_{j=1}^n |x_i - x_j| $$ In this case, the number of pairings is n·n, or n2.
A practical example
Consider a distribution with n=3 elements:
$$ X = \{ 2, 5, 6 \} $$
The mean absolute difference is calculated as follows:
$$ \Delta = \frac{1}{n \cdot (n-1)} \cdot \sum_{i=1}^n \sum_{j=1}^n |x_i - x_j| $$
$$ \Delta = \frac{1}{3 \cdot 2} \cdot \sum_{i=1}^3 \sum_{j=1}^3 |x_i - x_j| $$
$$ \Delta = \frac{1}{6} \cdot ( |2-2| + |2-5| + |2-6| + |5-2| + |5-5| + |5-6| + |6-2| + |6-5| + |6-6| )$$
$$ \Delta = \frac{1}{6} \cdot ( |0| + |-3| + |-4| + |3| + |0| + |-1| + |4| + |1| + |0| )$$
$$ \Delta = \frac{1}{6} \cdot ( 3 + 4 + 3 + 1 + 4 + 1) $$
$$ \Delta = \frac{1}{6} \cdot 16 $$
Thus, the mean absolute difference is:
$$ \Delta = 2.66 $$
Note. If I wanted to calculate the mean difference with repetition, I would use n2 in the denominator: $$ \Delta_R = \frac{1}{3^2} \cdot \sum_{i=1}^3 \sum_{j=1}^3 |x_i - x_j| $$ $$ \Delta_R = \frac{1}{9} \cdot 16 $$ $$ \Delta_R = 1.77 $$
The stepwise distance method
An alternative approach to calculating the mean absolute difference is based on stepwise distances.
First, sort the distribution X in non-decreasing order:
$$ X = \{ 2, 5, 6 \} $$
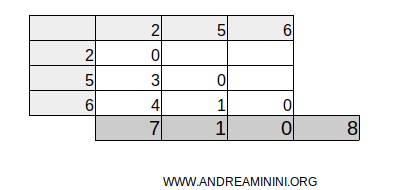
Then, construct the difference matrix:
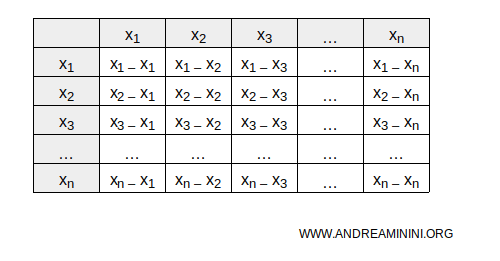
For the distribution X={2,5,6}, the difference matrix looks like this:
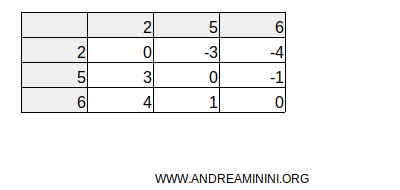
As you can see, the lower triangular matrix contains only positive differences.
The upper triangular matrix contains negative differences, which we discard as they are not needed.
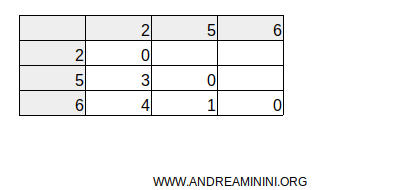
Next, sum the positive differences in each column:
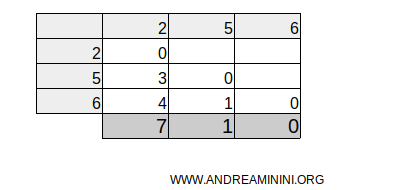
Then calculate the total sum.
In this case, the total sum is S=8.
Now, calculate the mean difference using this formula:
$$ \Delta = \frac{2 \cdot S}{n \cdot (n-1)} $$
Given that S=8 and n=3:
$$ \Delta = \frac{2 \cdot 8}{3 \cdot (3-1)} $$
$$ \Delta = \frac{16}{3 \cdot 2} $$
$$ \Delta = \frac{16}{6} $$
So, the mean difference is 2.66.
$$ \Delta = 2.66 $$
The final result is the same as in the previous example.
Key observations
Here are some key observations about the mean difference:
- The mean absolute difference with and without repetition are related by the following formula: $$ \Delta = \Delta_R \cdot \frac{n}{n-1} $$
Note. In the previous example, we calculated $$ \Delta = 2.66 $$ and $$ \Delta_R = 1.77 $$ The relationship between the two is: $$ \Delta = \Delta_R \cdot \frac{n}{n-1} $$ $$ 2.66 = 1.77 \cdot \frac{3}{3-1} $$ $$ 2.66 = \frac{1.77 \cdot 3}{2} $$ $$ 2.66 = 2.66 $$
- The mean difference ranges from 0 to infinity. It reaches its minimum value (Δ=0) when all elements in the distribution are identical.
- Another method for calculating the mean difference is as follows:
- Sort the elements of the distribution in non-decreasing order.
- Apply the following formula: $$ \Delta = \frac{1}{n(n-1)} \cdot 4 \sum_i^n (i \cdot x_i) - \frac{2 \mu (n+1) }{n-1} $$
Example. Using the same distribution from the previous example with n=3 elements: $$ X = \{ 2, 5, 6 \} $$ The mean of the distribution is: $$ \mu= \frac{2+5+6}{3} = \frac{13}{3} = 4.33333 $$ Now, applying the formula to calculate the mean difference: $$ \Delta = \frac{1}{n(n-1)} \cdot 4 \sum_i^n (i \cdot x_i) - \frac{2 \mu (n+1) }{n-1} $$ $$ \Delta = \frac{1}{3(3-1)} \cdot 4 \sum_i^n (i \cdot x_i) - \frac{8.66666 \cdot 4 }{2} $$ $$ \Delta = \frac{1}{6} \cdot 4 \sum_i^n (i \cdot x_i) - \frac{34.6666 }{2} $$ $$ \Delta = \frac{2}{3} \cdot \sum_i^n (i \cdot x_i) - 17.3333 $$ $$ \Delta = \frac{2}{3} \cdot [ (1 \cdot 2) + (2 \cdot 5) + (3 \cdot 6) ] - 17.3333 $$ $$ \Delta = \frac{2}{3} \cdot [ 2 + 10 + 18 ] - 17.3333 $$ $$ \Delta = \frac{2}{3} \cdot 30 - 17.3333 $$ $$ \Delta = 20 - 17.3333 $$ $$ \Delta = 2.66 $$ The result is the same as in the previous example.
- You can also calculate the mean difference with repetition using this alternative method:
- Sort the elements of the distribution in non-decreasing order.
- Apply this formula: $$ \Delta = \frac{1}{n^2} \cdot 4 \sum_i^n (i \cdot x_i) - \frac{2 \mu (n+1) }{n} $$
Example. Using the same distribution from the previous example with n=3 elements: $$ X = \{ 2, 5, 6 \} $$ The mean of the distribution is: $$ \mu = \frac{2+5+6}{3} = \frac{13}{3} = 4.33333 $$ Now, applying the formula to calculate the mean difference with repetition: $$ \Delta = \frac{1}{n^2} \cdot 4 \sum_i^n (i \cdot x_i) - \frac{2 \mu (n+1) }{n} $$ $$ \Delta = \frac{1}{3^2} \cdot 4 \sum_i^n (i \cdot x_i) - \frac{8.66666 \cdot (4) }{3} $$ $$ \Delta = \frac{4}{9} \cdot \sum_i^n (i \cdot x_i) - \frac{34.6666}{3} $$ $$ \Delta = \frac{4}{9} \cdot \sum_i^n (i \cdot x_i) - 11.5555 $$ $$ \Delta = \frac{4}{9} \cdot [ (1 \cdot 2) + (2 \cdot 5) + (3 \cdot 6) ] - 11.5555 $$ $$ \Delta = \frac{4}{9} \cdot [ 2 + 10 + 18 ] - 11.5555 $$ $$ \Delta = \frac{4}{9} \cdot 30 - 11.5555 $$ $$ \Delta = 13.3333 - 11.5555 $$ $$ \Delta = 1.77 $$ The result is the same as in the previous example.
- In the case of frequency distributions, the mean difference with repetition can be calculated using this formula: $$ \Delta_R = \frac{2}{n^2} \sum_{i=1}^{k-1} c_i(n-c_i)(x_{i+1} - x_i) $$ where n is the total frequency, ni is the frequency of the i-th class, ci is the cumulative frequency up to the i-th class, and xi represents the class values.
Example. Let’s consider a frequency distribution with k=7 class values.
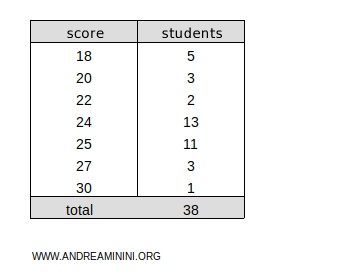
The mean difference is calculated as follows: $$ \Delta_R = \frac{2}{n^2} \sum_{i=1}^{k-1} c_i(n-c_i)(x_{i+1} - x_i) $$ $$ \Delta_R = \frac{2}{38^2} \sum_{i=1}^{7-1} c_i(38-c_i)(x_{i+1} - x_i) $$ $$ \Delta_R = \frac{2}{1444} \sum_{i=1}^{6} c_i(38-c_i)(x_{i+1} - x_i) $$ In this case, the sum is 2098.
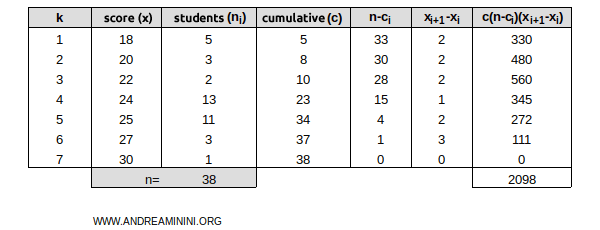
Therefore, the mean difference for this frequency distribution is 2.9: $$ \Delta_R = \frac{2}{1444} \cdot 2098 $$ $$ \Delta_R = 2.9 $$
And so on.


