Deviance in Statistics
In statistics, deviance is a measure of dispersion. It’s calculated by summing the squared deviations of data points from the mean of a distribution. $$ D(x) = \sum_{i=1}^n (x_i - \mu)^2 $$
For frequency distributions, the formula is:
$$ D(x) = \sum_{i=1}^n (x_i - \mu)^2 \cdot n_i $$
Where n represents the frequency, and x is the observed value.
Note: Deviance is the numerator in the calculation of variance.
Practical Examples
Example 1
Let’s consider a dataset of n=6 values:
$$ 1 \ , \ 5 \ , \ 7 \ , \ 3 \ , \ 6 \ , \ 8 $$
The arithmetic mean is μ=5
$$ \mu = \frac{1+5+7+3+6+8}{6 } = \frac{30}{6 } = 5 $$
Now, we can calculate the deviance of this dataset:
$$ D(x) = \sum_{i=1}^n (x_i - \mu)^2 $$
$$ D(x) = (1-5)^2 + (5-5)^2 + (7-5)^2 + (3-5)^2 + (6-5)^2 + (8-5)^2 $$
$$ D(x) = (-4)^2 + (0)^2 + (2)^2 + (-2)^2 + (1)^2 + (3)^2 $$
$$ D(x) = 16 + 0 + 4 + 4 + 1 + 9 $$
$$ D(x) = 34 $$
So, the deviance of this dataset is 34.
Example 2
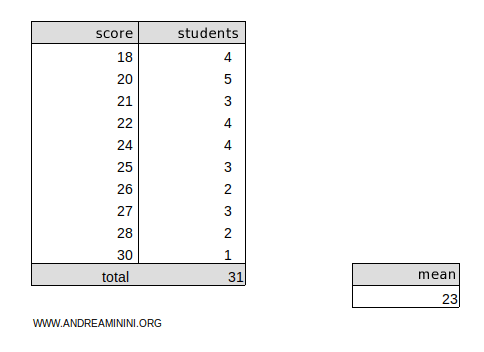
Next, consider the following frequency distribution:

The weighted arithmetic mean of this dataset is μ=23.
To calculate the deviance, we’ll use the formula for frequency distributions:
$$ D(x) = \sum_{i=1}^n (x_i - \mu)^2 \cdot n_i $$
$$ D(x) = (18 - 23 )^2 \cdot 4 + (20 - 23 )^2 \cdot 5 + (21 - 23 )^2 \cdot 3 + (22 - 23 )^2 \cdot 4 + (24 - 23 )^2 \cdot 4 + \\ + (25 - 23 )^2 \cdot 3 + (26 - 23 )^2 \cdot 2 + (27 - 23 )^2 \cdot 3 + (28 - 23 )^2 \cdot 2 + (30 - 23 )^2 \cdot 1 $$
$$ D(x) = (-5)^2 \cdot 4 + (-3)^2 \cdot 5 + (-2)^2 \cdot 3 + (-1)^2 \cdot 4 + (1)^2 \cdot 4 + \\ + (2)^2 \cdot 3 + (3)^2 \cdot 2 + (4)^2 \cdot 3 + (5)^2 \cdot 2 + (7)^2 \cdot 1 $$
$$ D(x) = 25 \cdot 4 + 9 \cdot 5 + 4 \cdot 3 + 1 \cdot 4 + 1 \cdot 4 + 4 \cdot 3 + 9 \cdot 2 + 16 \cdot 3 + 25 \cdot 2 + 49 \cdot 1 $$
$$ D(x) = 100 + 45 + 12 + 4 + 4 + 12 + 18 + 48 + 50 + 49 $$
$$ D(x) = 342 $$
So, the deviance of this frequency distribution is 342.
Further Observations
Here are a few additional points about deviance:
- An alternative formula for calculating deviance in a dataset is: $$ D(x) = \sum_{i=1}^n x_i^2 - \mu \sum_{i=1}^n x_i $$
Example: Consider a dataset with n=6 values and a mean of μ=5: $$ 1 \ , \ 5 \ , \ 7 \ , \ 3 \ , \ 6 \ , \ 8 $$ Using the simplified formula, deviance can be calculated as: $$ D(x) = \sum_{i=1}^n x_i^2 - \mu \sum_{i=1}^n x_i $$ $$ D(x)= (1^2+5^2+7^2+3^2+6^2+8^2) - 5 \cdot (1+5+7+3+6+8) $$ $$ D(x)= (1+25+49+9+36+64) - 5 \cdot 30 $$ $$ D(x)= 184 - 150 $$ $$ D(x) = 34 $$
- An alternative formula for calculating deviance in a frequency distribution is: $$ D(x) = \sum_{i=1}^n x^2_i n_i - \mu^2 \sum_{i=1}^n n_i $$
Proof: Let's start with the formula for deviance in a frequency distribution: $$ D(x) = \sum_{i=1}^k (x_i - \mu)^2 \cdot n_i $$ Expanding the squared binomial: $$ D(x) = \sum_{i=1}^k (x_i^2 + \mu^2 - 2x_i\mu) \cdot n_i $$ $$ D(x) = \sum_{i=1}^k x_i^2n_i + \mu^2n_i - 2x_i\mu n_i $$ Applying the properties of summations: $$ D(x) = \sum_{i=1}^k x_i^2n_i + \sum_{i=1}^k \mu^2n_i - 2 \sum_{i=1}^k x_i\mu n_i $$ $$ D(x) = \sum_{i=1}^k x_i^2n_i + \mu^2 \sum_{i=1}^k n_i - 2 \mu \sum_{i=1}^k x_i n_i $$ Since the arithmetic mean is μ=Σxini/Σni, it follows that Σxini= μΣni $$ D(x) = \sum_{i=1}^k x_i^2n_i + \mu^2 \sum_{i=1}^k n_i - 2 \mu \cdot ( \mu \sum_{i=1}^k n_i )$$ $$ D(x) = \sum_{i=1}^k x_i^2n_i + \mu^2 \sum_{i=1}^k n_i - 2 \mu^2 \sum_{i=1}^k n_i $$ Simplifying the second and third terms: $$ D(x) = \sum_{i=1}^k x_i^2n_i - \mu^2 \sum_{i=1}^k n_i $$
And so on.
