Mean Absolute Deviation
What is the mean absolute deviation?
The mean absolute deviation (MAD), sometimes called the average absolute deviation, is a measure of variability that tells us how far data values are, on average, from a central value. It is calculated by finding the absolute difference between each observation (xi) and a reference value (μ), and then taking the arithmetic mean of those differences.
$$ S = \frac{1}{n} \cdot \sum_{i=1}^n | x_i - \mu | $$
In most applications, μ is the arithmetic mean of the dataset. In some cases, however, the median may be used instead.
The mean absolute deviation is one of the simplest measures of dispersion. Unlike variance and standard deviation, it is expressed in the same units as the original data, making it particularly easy to interpret.
Why is it useful?
The mean absolute deviation shows how much the values in a dataset typically differ from the center of the distribution.
A small MAD indicates that the data points are clustered close to the mean, while a larger MAD suggests that the observations are more widely spread out.
Because the calculation uses absolute values, positive and negative deviations cannot offset one another. As a result, every observation contributes to the final measure of variability.
Note: For a frequency distribution, the mean absolute deviation is calculated using the following formula:
$$ S = \frac{ \sum |x_i - \mu| \cdot n_i}{ \sum n_i } $$
A practical example
Consider the following dataset containing six observations:
$$ x = \{ 4, 2, 6, 8, 7, 3 \} $$
The arithmetic mean is:
$$ \mu = \frac{4+2+6+8+7+3}{6} = \frac{30}{6} = 5 $$
Next, compute the absolute deviation of each observation from the mean:
$$ |4-5|,\ |2-5|,\ |6-5|,\ |8-5|,\ |7-5|,\ |3-5| $$
Substituting these values into the formula gives:
$$ S = \frac{1}{6} \cdot [ |4-5| + |2-5| + |6-5| + |8-5| + |7-5| + |3-5| ] $$
$$ S = \frac{1}{6} \cdot [ 1 + 3 + 1 + 3 + 2 + 2 ] $$
$$ S = \frac{12}{6} $$
$$ S = 2 $$
Therefore, the mean absolute deviation of the dataset is 2.
Example with a frequency distribution
Now consider the following frequency distribution, where the values represent the categories:
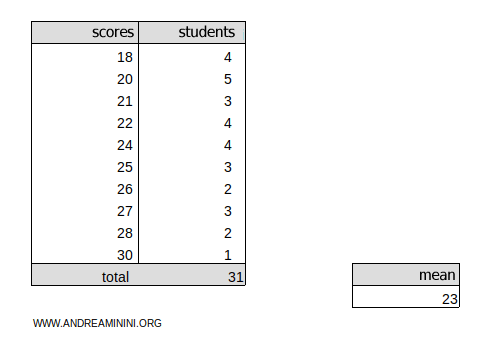
The weighted arithmetic mean of the distribution is:
$$ \mu = 23 $$
For a frequency distribution, the mean absolute deviation is computed using:
$$ S = \frac{ \sum |x_i - \mu| \cdot n_i}{ \sum n_i } $$
where xi represents the values and ni their frequencies.
The total frequency is:
$$ \sum n_i = 31 $$
Substituting the values into the formula:
$$ S = \frac{ |18-23| \cdot 4 + |20-23| \cdot 5 + |21-23| \cdot 3 + |22-23| \cdot 4 + |24-23| \cdot 4 + \\ + |25-23| \cdot 3 + |26-23| \cdot 2 + |27-23| \cdot 3 + |28-23| \cdot 2 + |30-23| \cdot 1 }{31} $$
$$ S = \frac{20 + 15 + 6 + 4 + 4 + 6 + 6 + 12 + 10 + 7}{31} $$
$$ S = \frac{90}{31} $$
$$ S \approx 2.9 $$
Therefore, the mean absolute deviation of this distribution is approximately 2.9.
Why do we use absolute values?
The key idea behind the mean absolute deviation is that positive and negative deviations would otherwise cancel each other out.
Suppose a dataset contains n values x1, x2, ..., xn with arithmetic mean μ. The average of the raw deviations from the mean is:
$$ \frac{(x_1 - \mu)+(x_2 - \mu)+...+(x_n - \mu)}{n} $$
Rearranging the terms gives:
$$ \frac{x_1+x_2+...+x_n - n\mu}{n} $$
Splitting the fraction yields:
$$ \frac{x_1+x_2+...+x_n}{n} - \mu $$
Since the first term is exactly the arithmetic mean:
$$ \mu - \mu = 0 $$
This shows that the average of the signed deviations from the mean is always zero. Consequently, it cannot be used to measure variability.
Taking absolute values solves this problem because every deviation contributes positively to the final result.
Example
Consider the dataset:
$$ 2,\ 4,\ 6,\ 8,\ 10 $$
The arithmetic mean is:
$$ \mu = \frac{2+4+6+8+10}{5} = 6 $$
The deviations from the mean are:
$$ -4,\ -2,\ 0,\ 2,\ 4 $$
Their sum is:
$$ (-4)+(-2)+0+2+4 = 0 $$
As a result, the average deviation is also zero:
$$ \frac{0}{5}=0 $$
Now take the absolute values:
$$ 4,\ 2,\ 0,\ 2,\ 4 $$
The sum of the absolute deviations is:
$$ 4+2+0+2+4 = 12 $$
Therefore, the mean absolute deviation is:
$$ \frac{12}{5} = 2.4 $$
This value tells us that, on average, the observations lie 2.4 units away from the arithmetic mean.
Key takeaway
The mean absolute deviation measures the average distance between the observations and a central value, usually the arithmetic mean. Because it relies on absolute distances rather than squared deviations, it is easy to understand and interpret, making it one of the most intuitive measures of statistical dispersion.