Percentiles
What are percentiles?
Percentiles (or centiles) are 99 positional markers that divide a statistical distribution into one hundred equal parts.
Each part represents a group with an equal number of elements.
There are ninety-nine percentiles:
- The first percentile (P1) includes the lowest 1% of elements in the distribution.
- The second percentile (P2) includes the lowest 2% of elements in the distribution.
- The ninety-ninth percentile (P99) includes the lowest 99% of elements in the distribution.
Example: In a dataset of 100 values, the fiftieth percentile (P50) is the value that splits the distribution in half and corresponds to the median. The 25th percentile aligns with the first quartile, the 20th percentile with the first quintile, and the 10th percentile with the first decile, and so on.
How to calculate percentiles
There are two methods to calculate percentiles, depending on whether you're working with a series of values or a frequency distribution.
For a series of values
To calculate percentiles from a series of values:
- First, sort the values in ascending order.
- Multiply the number of elements in the series by p=1/100 for P1, p=2/100 for P2, and so on, up to p=99/100 for P99. $$ k = n \cdot p $$
- Determine the percentile's position:
- If k is an integer, the percentile is the average of the values at the k-th and (k+1)-th positions.
- If k is not an integer, round up to the next whole number. The percentile will be the value at position k.
For frequency distributions
To calculate percentiles for a frequency distribution:
- Calculate the cumulative absolute frequencies for each class in the distribution.
- Divide the total cumulative frequency by 1/100, 2/100, ..., up to 99/100 to find the positions of the percentiles (P1, P2, ..., P99) within the cumulative frequencies.
- Identify the cumulative frequency intervals that include the positions of the percentiles. The corresponding frequency classes represent the percentiles in the distribution.
Note: There are various methods for calculating percentiles. This is just one approach. Sometimes, the central value of the class is used, while other times linear interpolation is applied to get a more precise value.
A practical example
Example 1
This dataset contains n=9 values:
$$ X = \{ 9,6,11,8,4,7,10,3,5 \} $$
First, sort the values in ascending order:
$$ X = \{ 3,4,5,6,7,8,9,10,11 \} $$
To calculate the 45th percentile (P45), multiply the number of values (n=9) by 45/100:
$$ k = n \cdot \frac{45}{100} = 9 \cdot \frac{45}{100} =4.05 $$
Since k=4.05 is a decimal, round up to the next whole number, so k=5.
$$ X = \{ 3,4,5, 6,\color{red}{7},8,9,10,11 \} $$
The 5th value in the sorted series is 7.
$$ P_{45} = 7 $$
Therefore, the 45th percentile of this dataset is 7.
$$ X = \{ 3,4,5, 6,\underbrace{7}_{P_{45}},8,9,10,11 \} $$
Now, to calculate the 72nd percentile (P72), multiply the number of values (n=9) by 72/100:
$$ k = n \cdot \frac{72}{100} = 9 \cdot \frac{72}{100} =6.48 $$
Since k=6.48 is a decimal, round up to the next whole number, so k=7.
$$ X = \{ 3,4,5,6,7,8,\color{red}{9},10,11 \} $$
The 7th value in the sorted series is 9.
$$ P_{72} = 9 $$
Thus, the 72nd percentile of this dataset is 9.
$$ X = \{ 3,4,5,6,7 ,8,\underbrace{9}_{P_{72}},10,11 \} $$
Note: In this case, the percentile is a value within the dataset. However, this is not always the case.
Example 2
Now, let's remove one element from the previous dataset. The new dataset has n=8 values:
$$ X = \{ 9,6,8,4,7,10,3,5 \} $$
Sort the values in ascending order:
$$ X = \{ 3,4,5,6,7,8,9,10 \} $$
To calculate the 50th percentile (P50), multiply the number of values (n=8) by 50/100:
$$ k = n \cdot \frac{50}{100} = 8 \cdot \frac{50}{100} =4 $$
Since k=4 is an integer, take the average of the values at position k=4 and k+1=5.
$$ X = \{ 3,4,5,\color{red}6,\color{red}7,8,9,10 \} $$
The 4th value is 6 and the 5th value is 7.
Therefore, the 50th percentile of this dataset is 6.5.
$$ P_{50} = \frac{6+7}{2} = 6.5 $$
Note: In this case, the percentile is not a value from the dataset itself.
Example 3
Now, consider this frequency distribution:
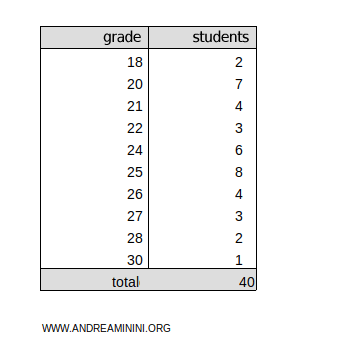
These represent exam scores, with the possible grades ranging from 18 to 30, and the number of students corresponding to their respective absolute frequencies.
To find the percentiles, add a column for cumulative frequencies, starting with the first grade.
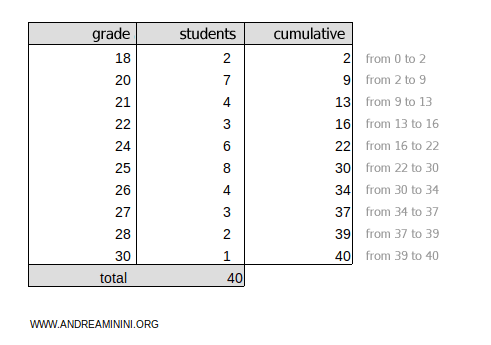
The total cumulative frequency is ftot=40.
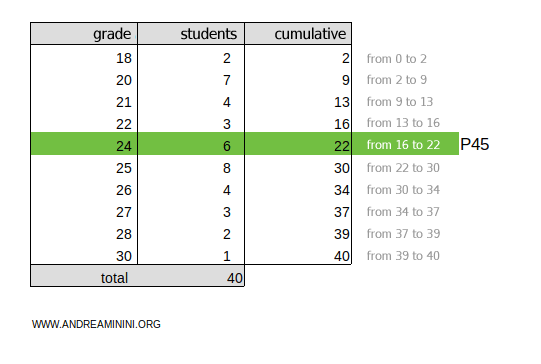
To find the 45th percentile, multiply the cumulative frequencies ftot=40 by 45/100:
$$ k =f_{tot} \cdot \frac{45}{100} = 40 \cdot \frac{45}{100} = 18 $$
The result, 18, falls within the 16-22 cumulative frequency range.
Thus, the 45th percentile (P45) is the grade 24.
Example 4
This frequency distribution is divided into classes:
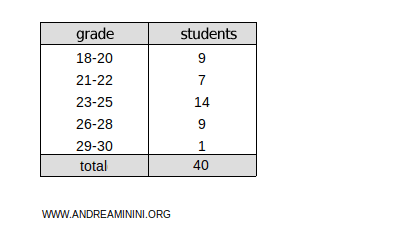
Add a new column to display the cumulative absolute frequencies.
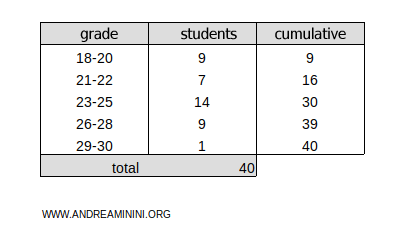
The total cumulative frequency is ftot=40.
To find the 72nd percentile (P72), multiply the cumulative frequency ftot=40 by 72/100:
$$ k =f_{tot} \cdot \frac{72}{100} = 40 \cdot \frac{72}{100} = 28.8 $$
Since k=28.8 is a decimal, round it up to the next whole number, k=29.
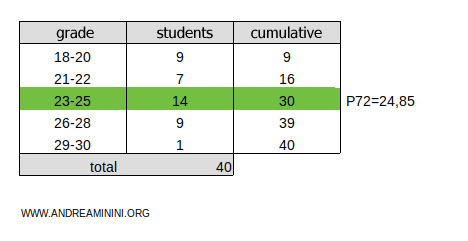
The result, k=29, falls within the cumulative frequency range of 16-30 for the 23-25 class.
In this case, use linear interpolation to calculate the exact percentile value:
$$ P_{72} = x_{inf} + (x_{sup} - x_{inf}) \cdot \frac{ c - n_{prec} }{n_{classe}} $$
Here's what each term means:
- xinf=23 and xsup=25 are the boundaries of the 23-25 class.
- c=29 is the position of the percentile.
- nclasse=14 is the frequency of the 23-25 class.
- nprec=16 is the cumulative frequency of the classes before the 23-25 class.
Now, substitute the values and calculate:
$$ P_{72} = 23 + (25 - 23) \cdot \frac{ 29 - 16 }{14} $$
$$ P_{72} = 23 + 2 \cdot \frac{ 13 }{14} $$
$$ P_{72} = 24.85 $$
Thus, the 72nd percentile is P72=24.85.
And so on.
