Quintiles
What are quintiles?
Quintiles are four position indices (quantiles) that divide a statistical distribution into five equal parts.
Each part contains the same number of elements.
There are four quintiles:
- The first quintile (Q1) groups the lowest 1/5 (20%) of the elements in the distribution.
- The second quintile (Q2) includes the lowest 2/5 (40%) of the distribution.
- The third quintile (Q3) encompasses the lowest 3/5 (60%) of the distribution.
- The fourth quintile (Q4) includes the lowest 4/5 (80%) of the distribution.
Example. In this sequence, the first quintile Q1=4.5, the second quintile Q2=6.5, the third quintile Q3=8.5, and the fourth quintile Q4=10.5 divide the distribution into five equal parts, with each part containing two elements. $$ X = \{ \underbrace{3,4}, \color{red}{Q_1}, \underbrace{5, 6}, \color{red}{ Q_2 }, \underbrace{7, 8}, \color{red}{Q_3}, \underbrace{9, 10}, \color{red}{Q_4}, \underbrace{11, 12} \} $$ Sometimes, people refer to the zero quintile (Q0), which is simply the first element in the ordered distribution (e.g., 3), and to the fifth quintile (Q4), which is the last element (e.g., 12).
How to calculate quintiles
To calculate quintiles, you can use one of two methods, depending on whether your data is a series of values or a frequency distribution.
Value series
To calculate the quintiles of a value series:
- Sort the values in ascending order.
- Multiply the total number of elements by p=1/5 for Q1, p=2/5 for Q2, p=3/5 for Q3, and p=4/5 for Q4: $$ k = n \cdot p $$
- Determine the position of the quintile:
- If k is an integer, the quintile value is the average of the k-th and (k+1)-th elements in the distribution.
- If k is not an integer, round k up to the nearest whole number.
Frequency distributions
To calculate quintiles in a frequency distribution:
- First, calculate the cumulative absolute frequencies for each class.
- Divide the total cumulative frequency by 1/5, 2/5, 3/5, and 4/5. This gives you the positions of Q1, Q2, Q3, and Q4 in the cumulative frequencies.
- Identify the intervals in the cumulative frequencies that contain the positions for Q1, Q2, Q3, and Q4. The corresponding classes are the quintiles for the distribution.
Note. You can calculate the exact quintile values in several ways. For instance, you can take the midpoint of the class or use linear interpolation between the class limits.
A practical example
Example 1
Here’s a distribution with n=9 elements:
$$ X = \{ 9,6,11,8,4,7,10,3,5 \} $$
First, sort the values in ascending order:
$$ X = \{ 3,4,5,6,7,8,9,10,11 \} $$
To calculate the first quintile (Q1), multiply the number of elements (n=9) by 1/5:
$$ k = n \cdot \frac{1}{5} = 9 \cdot \frac{1}{5} =1.8 $$
Since the result is a decimal (k=1.8), round up to the nearest whole number (k=2):
$$ X = \{ 3,\color{red}{4},5,6,7,8,9,10,11 \} $$
The second element (k=2) is 4, so:
$$ Q_1 = 4 $$
Thus, the first quintile of this distribution is Q1=4:
$$ X = \{ 3,\underbrace{4}_{Q_1}, 5,6,7,8,9,10,11 \} $$
To calculate the second quintile (Q2), multiply the number of elements (n=9) by 2/5:
$$ k = n \cdot \frac{2}{5} = 9 \cdot \frac{2}{5} =3.6 $$
Since the result is a decimal (k=3.6), round up to the nearest whole number (k=4):
$$ X = \{ 3,4,5,\color{red}{6},7,8,9,10,11 \} $$
The fourth element (k=4) is 6, so:
$$ Q_2 = 6 $$
Thus, the second quintile is Q2=6:
$$ X = \{ 3,4,5,\underbrace{6}_{Q_2},7,8,9,10,11 \} $$
To calculate the third quintile (Q3), multiply the number of elements (n=9) by 3/5:
$$ k = n \cdot \frac{3}{5} = 9 \cdot \frac{3}{5} =5.4 $$
Since the result is a decimal (k=5.4), round up to the nearest whole number (k=6):
$$ X = \{ 3,4,5,6,7,\color{red}{8},9,10,11 \} $$
The sixth element (k=6) is 8, so:
$$ Q_3 = 8 $$
Thus, the third quintile is Q3=8:
$$ X = \{ 3,4,5,6,7,\underbrace{8}_{Q_3},9,10,11 \} $$
To calculate the fourth quintile (Q4), multiply the number of elements (n=9) by 4/5:
$$ k = n \cdot \frac{4}{5} = 9 \cdot \frac{4}{5} =7.2 $$
Since the result is a decimal (k=7.2), round up to the nearest whole number (k=8):
$$ X = \{ 3,4,5,6,7,8,9,\color{red}{10},11 \} $$
The eighth element (k=8) is 10, so:
$$ Q_4 = 10 $$
Thus, the fourth quintile is Q4=10:
$$ X = \{ 3,4,5,6,7,8,9,\underbrace{10}_{Q_4},11 \} $$
Example 2
Now, let’s add an extra element to the previous distribution, bringing the total to n=10:
$$ X = \{ 9,6,8,4,7,10,3,5,11,12 \} $$
Sort the data in ascending order:
$$ X = \{ 3,4,5,6,7,8,9,10,11,12 \} $$
To calculate the first quintile (Q1), multiply the number of elements (n=10) by 1/5:
$$ k = n \cdot \frac{1}{5} = 10 \cdot \frac{1}{5} =2 $$
Since k=2 is an integer, calculate the average of the second and third elements:
$$ X = \{ 3,\color{red}{4},\color{red}{5},6,7,8,9,10,11,12 \} $$
The second element (k=2) is 4 and the third (k=3) is 5, so:
$$ Q_1 = \frac{4+5}{2} = 4.5 $$
To calculate the second quintile (Q2), multiply the number of elements (n=10) by 2/5:
$$ k = n \cdot \frac{2}{5} = 10 \cdot \frac{2}{5} =4 $$
Since k=4 is an integer, calculate the average of the fourth and fifth elements:
$$ X = \{ 3,4,5,\color{red}{6},\color{red}{7},8,9,10,11,12 \} $$
The fourth element (k=4) is 6 and the fifth (k=5) is 7, so:
$$ Q_2 = \frac{6+7}{2} = 6.5 $$
To calculate the third quintile (Q3), multiply the number of elements (n=10) by 3/5:
$$ k = n \cdot \frac{3}{5} = 10 \cdot \frac{3}{5} =6 $$
Since k=6 is an integer, calculate the average of the sixth and seventh elements:
$$ X = \{ 3,4,5,6,7,\color{red}{8},\color{red}{9},10,11,12 \} $$
The sixth element (k=6) is 8 and the seventh (k=7) is 9, so:
$$ Q_3 = \frac{8+9}{2} = 8.5 $$
To calculate the fourth quintile (Q4), multiply the number of elements (n=10) by 4/5:
$$ k = n \cdot \frac{4}{5} = 10 \cdot \frac{4}{5} =8 $$
Since k=8 is an integer, calculate the average of the eighth and ninth elements:
$$ X = \{ 3,4,5,6,7,8,9,\color{red}{10},\color{red}{11},12 \} $$
The eighth element (k=8) is 10 and the ninth (k=9) is 11, so:
$$ Q_4 = \frac{10+11}{2} = 10.5 $$
Thus, the four quintiles Q1=4.5, Q2=6.5, Q3=8.5, and Q4=10.5 divide the distribution into five parts:
$$ X = \{ \underbrace{3,4}, \color{red}{Q_1}, \underbrace{5,6}, \color{red}{Q_2}, \underbrace{7,8}, \color{red}{Q_3}, \underbrace{9,10}, \color{red}{Q_4}, \underbrace{11,12} \} $$
Note. In this case, the four quintiles are approximate values and do not belong to the original dataset.
Example 3
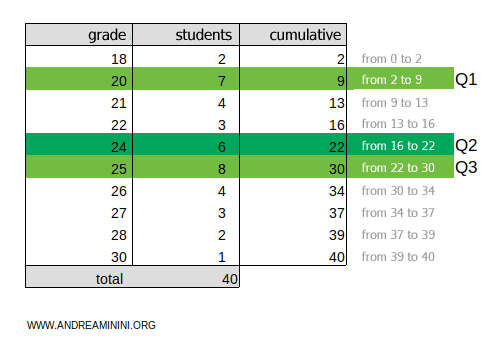
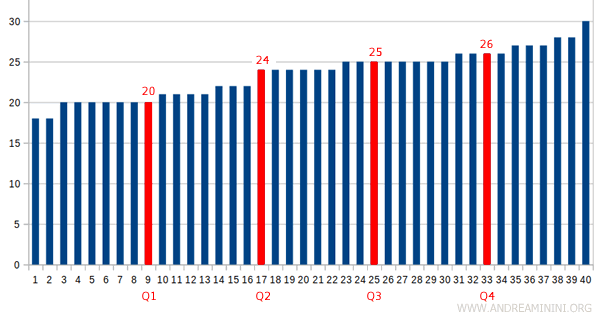
Let’s consider this frequency distribution:
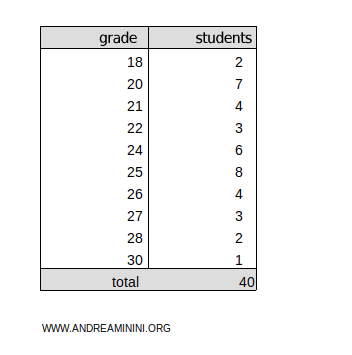
This represents the grades earned by 40 students in an exam. The grades, ranging from 18 to 30, correspond to the observed outcomes, and the absolute frequency indicates how many students earned each grade.
To calculate the quintiles, we need to add a column for the cumulative frequencies.
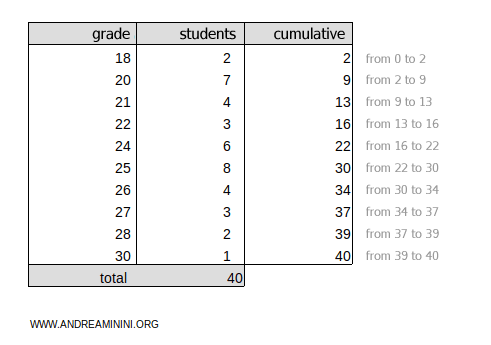
The total cumulative frequency is ftot=40.
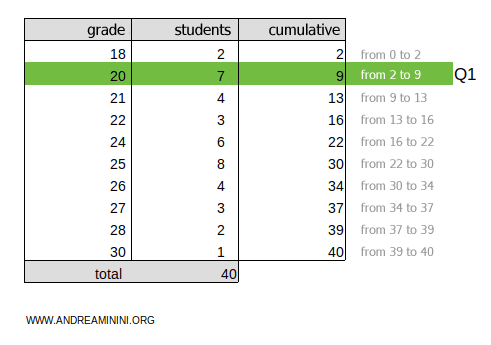
To find the first quintile, multiply the total cumulative frequency ftot=40 by 1/5:
$$ k = f_{tot} \cdot \frac{1}{5} = 40 \cdot \frac{1}{5} = 8 $$
The result, 8, falls within the 2-9 cumulative frequency range.
Thus, the first quintile is in the 20-point range.
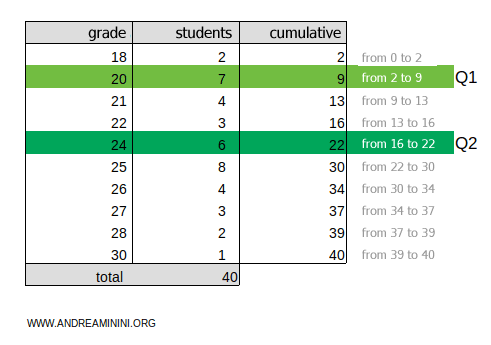
To find the second quintile, multiply the cumulative total ftot=40 by 2/5:
$$ k = f_{tot} \cdot \frac{2}{5} = 40 \cdot \frac{2}{5} = 16 $$
The result, 16, falls within the 16-22 cumulative frequency range.
Thus, the second quintile is in the 24-point range.
To find the third quintile, multiply the cumulative total ftot=40 by 3/5:
$$ k = f_{tot} \cdot \frac{3}{5} = 40 \cdot \frac{3}{5} = 24 $$
The result, 24, falls within the 22-30 cumulative frequency range.
Thus, the third quintile is in the 25-point range.
To find the fourth quintile, multiply the cumulative total ftot=40 by 4/5:
$$ k = f_{tot} \cdot \frac{4}{5} = 40 \cdot \frac{4}{5} = 32 $$
The result, 32, falls within the 30-34 cumulative frequency range.
Thus, the fourth quintile is in the 26-point range.
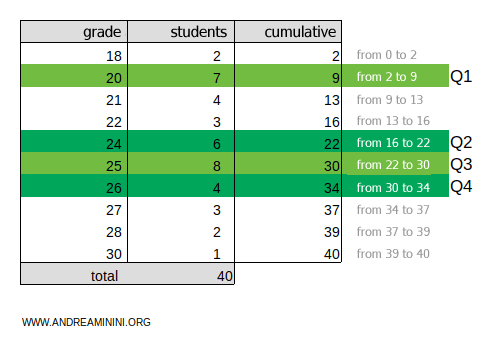
Note. When you arrange the 40 grades from lowest to highest, the four quintiles (Q1, Q2, Q3, and Q4) divide the dataset into five equal parts.
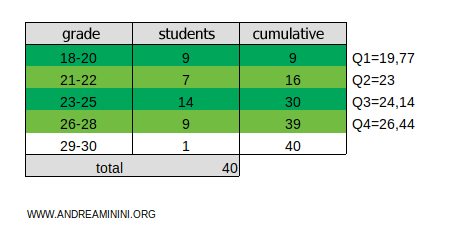
Example 4
This frequency distribution is divided into five classes:
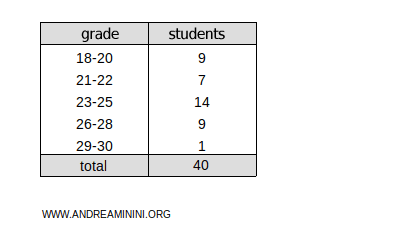
Now, let’s add a column for the cumulative absolute frequencies:
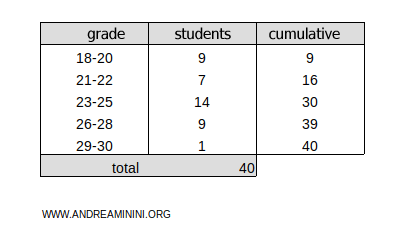
The total cumulative frequency is ftot=40.
To calculate the first quintile (Q1), multiply the cumulative frequency ftot=40 by 1/5:
$$ k = f_{tot} \cdot \frac{1}{5} = 40 \cdot \frac{1}{5} = 8 $$
The result, 8, falls within the cumulative frequency range of 1 to 9 for the 18-20 class.
Use linear interpolation to get the exact quintile value:
$$ Q_1 = x_{inf} + (x_{sup} - x_{inf}) \cdot \frac{c - n_{prec}}{n_{classe}} $$
The terms mean the following:
- xinf=18 and xsup=20 are the limits of the 18-20 class.
- c=8 is the position of the first quintile.
- nclasse=9 is the frequency of the 18-20 class.
- nprec=0 is the cumulative frequency of the classes before the 18-20 class.
Now, plug in the values and perform the calculations:
$$ Q_1 = 18 + (20 - 18) \cdot \frac{8 - 0}{9} $$
$$ Q_1 = 18 + 2 \cdot \frac{8}{9} $$
$$ Q_1 = 19.77 $$
Thus, the first quintile is Q1=19.77.
Note. Alternatively, you can find an approximate value for the first quintile by calculating the class midpoint. In this case, the midpoint of the 18-20 class is 19. Therefore, the approximate value of the first quintile is Q1=19. While less precise than linear interpolation, this method is quicker to calculate.
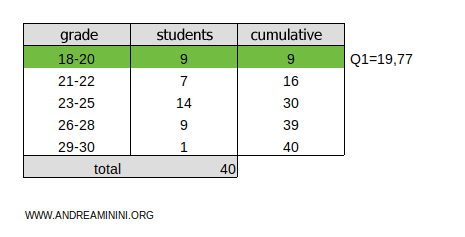
To calculate the second quintile (Q2), multiply the cumulative frequency ftot=40 by 2/5:
$$ k = f_{tot} \cdot \frac{2}{5} = 40 \cdot \frac{2}{5} = 16 $$
The result, 16, falls within the cumulative frequency range of 16 to 30 for the 23-25 class.
Use linear interpolation to find the exact value of the second quintile:
$$ Q_2 = x_{inf} + (x_{sup} - x_{inf}) \cdot \frac{c - n_{prec}}{n_{classe}} $$
The terms mean the following:
- xinf=23 and xsup=25 are the limits of the 23-25 class.
- c=16 is the position of the second quintile.
- nclasse=14 is the frequency of the 23-25 class.
- nprec=16 is the cumulative frequency of the classes before the 23-25 class.
Now, plug in the values and perform the calculations:
$$ Q_2 = 23 + (25 - 23) \cdot \frac{16 - 16}{14} $$
$$ Q_2 = 23 + 2 \cdot \frac{0}{14} $$
$$ Q_2 = 23 $$
Thus, the second quintile is Q2=23.
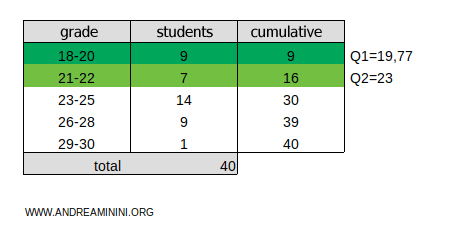
To calculate the third quintile (Q3), multiply the cumulative frequency ftot=40 by 3/5:
$$ k = f_{tot} \cdot \frac{3}{5} = 40 \cdot \frac{3}{5} = 24 $$
The result, 24, falls within the cumulative frequency range of 16 to 30 for the 23-25 class.
Use linear interpolation to calculate the exact value of the third quintile:
$$ Q_3 = x_{inf} + (x_{sup} - x_{inf}) \cdot \frac{c - n_{prec}}{n_{classe}} $$
The terms mean the following:
- xinf=23 and xsup=25 are the limits of the 23-25 class.
- c=24 is the position of the third quintile.
- nclasse=14 is the frequency of the 23-25 class.
- nprec=16 is the cumulative frequency of the classes before the 23-25 class.
Now, plug in the values and perform the calculations:
$$ Q_3 = 23 + (25 - 23) \cdot \frac{24 - 16}{14} $$
$$ Q_3 = 23 + 2 \cdot \frac{8}{14} $$
$$ Q_3 = 24.14 $$
Thus, the third quintile is Q3=24.14.
To calculate the fourth quintile (Q4), multiply the cumulative frequency ftot=40 by 4/5:
$$ k = f_{tot} \cdot \frac{4}{5} = 40 \cdot \frac{4}{5} = 32 $$
The result, 32, falls within the cumulative frequency range of 30 to 39 for the 26-28 class.
Use linear interpolation to calculate the exact value of the fourth quintile:
$$ Q_4 = x_{inf} + (x_{sup} - x_{inf}) \cdot \frac{c - n_{prec}}{n_{classe}} $$
The terms mean the following:
- xinf=26 and xsup=28 are the limits of the 26-28 class.
- c=32 is the position of the fourth quintile.
- nclasse=9 is the frequency of the 26-28 class.
- nprec=30 is the cumulative frequency of the classes before the 26-28 class.
Now, plug in the values and perform the calculations:
$$ Q_4 = 26 + (28 - 26) \cdot \frac{32 - 30}{9} $$
$$ Q_4 = 26 + 2 \cdot \frac{2}{9} $$
$$ Q_4 = 26.44 $$
Thus, the fourth quintile is Q4=26.44.
And so on.


