Confidence Interval
A confidence interval is a range of values used in statistics to estimate a population parameter (such as the mean \( \mu \)) with a certain degree of confidence.
In simpler terms, a confidence interval gives a range of values that likely includes the true value of a population parameter, like the mean \( \mu \), with a specific level of statistical certainty.
It’s useful because it provides an indication of the uncertainty associated with a sample statistic, such as the sample mean \( \bar{x} \), which is used to estimate the true population mean \( \mu \).
Confidence Interval Formula
The general formula for a confidence interval for the mean \( \mu \), assuming a normal distribution and known variance, is:
$$ \bar{x} \pm z_{\alpha/2} \cdot \frac{\sigma}{\sqrt{n}} $$
Where:
- \( \bar{x} \) is the sample mean,
- \( z_{\alpha/2} \) is the critical value corresponding to the chosen confidence level (for example, 1.96 for 95%),
- \( \sigma \) is the population standard deviation (or an estimate),
- \( n \) is the sample size.
Note: If the population variance is unknown, it's better to use the \( t \)-distribution instead of the normal distribution to calculate the confidence interval.
To construct a confidence interval, you first select a confidence level \( 1 - \alpha \).
The confidence level represents the probability that the calculated interval contains the true value of the population parameter.
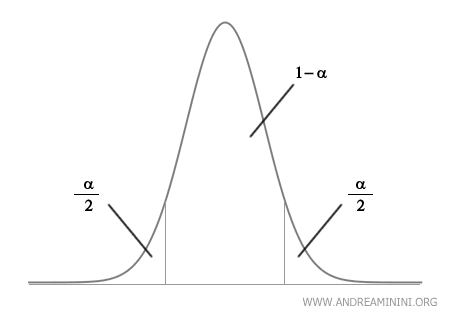
The parameter \( \alpha \) is referred to as the significance level (or the complement of the confidence level), which is the probability that the interval does not include the true value of the parameter.
For instance, a 95% confidence interval \( 1 - \alpha = 95% \) means that if the experiment were repeated many times, 95% of the calculated intervals would include the true population mean \( \mu \). In this case, the significance level \( \alpha \) is 0.05, or 5%. This implies there’s a 5% chance that the calculated interval does not contain the true value of the parameter.
Therefore, the confidence level reflects how confident I am in my estimate.
A Practical Example
Let’s say we want to estimate the mean \( \mu \) weight of students at a school with thousands of students.
We take a sample of 100 students, where the sample mean \( \bar{x} \) is 70 kg, and the known population standard deviation \( \sigma \) is 10 kg.
We decide to calculate a 95% confidence interval for the mean student weight.
The formula for the confidence interval is:
$$ \bar{x} \pm z_{\alpha/2} \cdot \frac{\sigma}{\sqrt{n}} $$
Given that the sample mean is \( \bar{x} = 70 \), the population standard deviation is \( \sigma = 10 \), and the sample size is \( n = 100 \)
$$ 70 \pm z_{\alpha/2} \cdot \frac{10}{\sqrt{100}} $$
For a 95% confidence level, the critical value \( z_{\alpha/2} \) in a normal distribution is 1.96.
$$ 70 \pm 1.96 \cdot \frac{10}{\sqrt{100}} $$
$$ 70 \pm 1.96 \cdot 1 $$
$$ 70 \pm 1.96 $$
So, the confidence interval is:
$$ [70 - 1.96, 70 + 1.96] = [68.04, 71.96] $$
This means that, with 95% confidence, we can say the average student weight lies between 68.04 kg and 71.96 kg.
And so on.


