Difference Between Interpolation and Regression
Interpolation focuses on estimating missing values within the range of available data points. In contrast, regression is used to predict values beyond the existing data range.
The difference between statistical, mathematical interpolation, and regression lies in their approaches and the specific applications for estimating or modeling data.
- Mathematical Interpolation
Mathematical interpolation is a method used to create a continuous function \( f(x) \) that passes exactly through a set of known points \( (x_i, y_i) \). It’s applied when the values at certain points are known, and there’s a need to estimate values in between. Common techniques include linear interpolation between two points or polynomial interpolation through multiple points.
Example: If I have three points \((1, 2)\), \((2, 3)\), and \((3, 5)\), polynomial interpolation can create a second-degree polynomial that fits exactly through these points.
- Statistical Interpolation
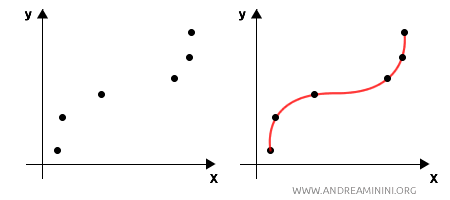
Statistical interpolation is similar to mathematical interpolation but is applied when the data are sample observations subject to variability or noise. Unlike the mathematical version, the function $ f(x) $ does not necessarily pass through every observed point. Instead, the curve approximates the points to create a smooth estimate of intermediate values within the observed data range.
It is used to estimate values between known points while accounting for uncertainty or variability in the data, but it typically stays within the observed data range. It’s not designed to make predictions beyond the available data (extrapolation) since it does not form a model that generalizes to data outside the sample.For example, if I have temperature readings recorded at various times of the day, statistical interpolation can estimate the temperature between two measurements, but it isn’t suitable for predicting temperatures on future days or outside the recorded range.
- Regression
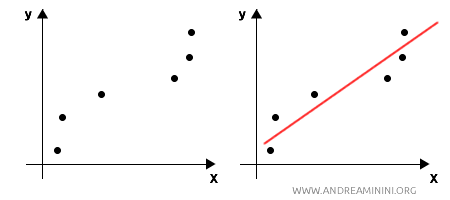
Regression is a statistical technique used to model the relationship between a dependent variable (response variable) and one or more independent variables (predictors). Unlike mathematical interpolation, regression doesn’t aim to go through all the points precisely but instead looks for the overall trend in the data. The goal is to find the function that best fits the data, even outside the observed range.
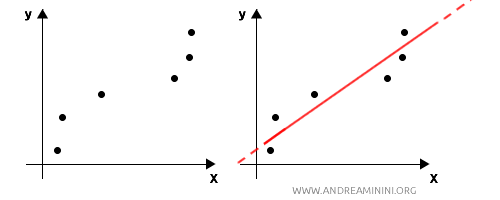
Thus, regression is primarily predictive, seeking to forecast future data patterns. A regression model not only explains the observed data but is also used to predict future outcomes or estimate unobserved values. Typically, it finds a function $ f(x) $ that minimizes the sum of the squared differences between observed and estimated values (least squares method). The function can be linear (linear regression), polynomial (higher degree), or based on more complex models (e.g., logistic regression, nonlinear regression, etc.).For instance, I could develop a linear regression model to predict house prices based on factors like size, number of rooms, and location. This model would allow me to predict the price of a similar house that hasn’t yet been observed.
In summary, both mathematical and statistical interpolation estimate intermediate data values, but the former assumes an exact fit through observed data points, while the latter accounts for variability and is more approximate.
Regression, on the other hand, focuses on finding a model that captures the overall trend in the data, without necessarily fitting every point, and is capable of making predictions beyond the observed range.
And so on.


