Linear Interpolation
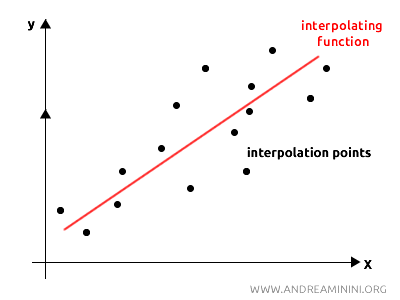
A linear interpolating function is a function that approximates a series of data points \( (x_i, y_i) \) using a line.
The purpose of linear interpolation is to find a line that either "passes through" or gets as close as possible to these points, minimizing the overall distance between the line and the points.

Calculating the Interpolating Line
Given a set of points \( (x_1, y_1), (x_2, y_2), \ldots, (x_n, y_n) \), the linear interpolating function is expressed as a line in the form:
$$ y = ax + b $$
Here, \( a \) represents the slope of the line, and \( b \) is the y-intercept.
To determine these coefficients \( a \) and \( b \), the goal is to make the line best match the trend in the data.
To achieve this, the sum of the squares of the differences between the actual values \( y_i \) and the predicted values from the line \( ax_i + b \) is minimized using a technique known as the least squares method.
$$ S(a; b) = \sum_{i=1}^{n} (y_i - ax_i - b)^2 $$
The equation of the interpolating line that minimizes this sum of squares is as follows:
$$ y - \bar{y} = a(x - \bar{x}) $$
Where \( \bar{x} \) is the average of the independent variable \( x \), and \( \bar{y} \) is the average of the dependent variable \( y \).
$$ \bar{x} = \frac{1}{n} \cdot \sum_{i=1}^n x_i $$
$$ \bar{y} = \frac{1}{n} \cdot \sum_{i=1}^n y_i $$
The point \( (\bar{x}; \bar{y}) \), known as the "centroid" of the data distribution, is where the line intersects the midpoint of the \( x \) and \( y \) values.
The formula for the coefficient \( a \), which represents the slope, is:
$$ a = \frac{ \sum_{i=1}^n (x_i-\bar{x}) \cdot (y_i-\bar{y}) }{ \sum_{i=1}^n {(x_i-\bar{x})^2} } $$
The result is a linear regression line that best approximates the set of points.
A Practical Example
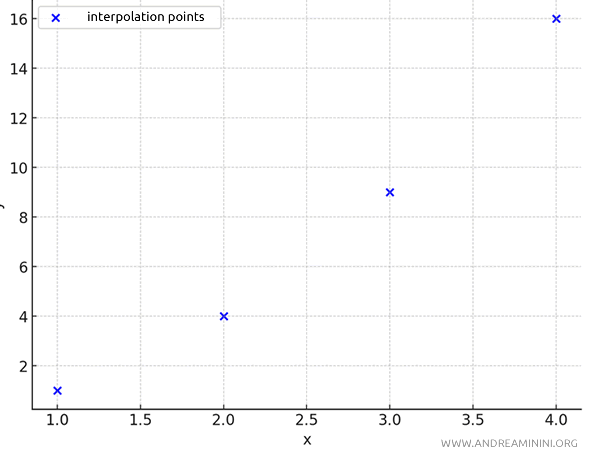
Let's consider a set of \( n=4 \) known points (x; y).
| x | y |
|---|---|
| 1 | 1 |
| 2 | 4 |
| 3 | 9 |
| 4 | 16 |
These points are scattered on the Cartesian plane within the interval (1, 4).

To find a line that smoothly approximates the data, we use the equation of the interpolating function.
$$ y - \bar{y} = a(x - \bar{x}) $$
We calculate the averages of the variables \( x \) and \( y \).
$$ \bar{x} = \frac{1+2+3+4}{4} = \frac{10}{4} $$
$$ \bar{y} = \frac{1+4+9+16}{4} = \frac{30}{4} $$
We substitute the average values \( \bar{x} = \frac{10}{4} \) and \( \bar{y} = \frac{30}{4} \) into the equation for the interpolating line.
$$ y - \bar{y} = a(x - \bar{x}) $$
$$ y - \frac{30}{4} = a(x - \frac{10}{4}) $$
Now, we calculate the coefficient \( a \), which determines the slope of the line using the formula:
$$ a = \frac{ \sum_{i=1}^n (x_i-\bar{x}) \cdot (y_i-\bar{y}) }{ \sum_{i=1}^n {(x_i-\bar{x})^2} } $$
Given that there are \( n=4 \) points and the averages are \( \bar{x} = \frac{10}{4} \) and \( \bar{y} = \frac{30}{4} \),
$$ a = \frac{ \sum_{i=1}^4 (x_i- \frac{10}{4}) \cdot (y_i- \frac{30}{4}) }{ \sum_{i=1}^4 {(x_i- \frac{10}{4})^2} } $$
The table below summarizes the calculations for each point \( (x_i, y_i) \), showing the differences from the averages, the products of these differences, and the squares of the differences in \( x_i \).
$$ \begin{array}{|c|c|c|c|c|c|} \hline x_i & y_i & x_i - \bar{x} & y_i - \bar{y} & (x_i - \bar{x})(y_i - \bar{y}) & (x_i - \bar{x})^2 \\ \hline 1 & 1 & -1.5 & -6.5 & 9.75 & 2.25 \\ 2 & 4 & -0.5 & -3.5 & 1.75 & 0.25 \\ 3 & 9 & 0.5 & 1.5 & 0.75 & 0.25 \\ 4 & 16 & 1.5 & 8.5 & 12.75 & 2.25 \\ \hline \end{array} $$
We substitute the result into the formula to calculate the coefficient \( a \):
$$ a = \frac{ 9.75+1.75+0.75+12.75 }{ 2.25+0.25+0.25+2.25 } $$
$$ a = \frac{25}{5} = 5 $$
The slope \( a \) is 5.
We substitute the coefficient \( a=5 \) back into the equation for the interpolating line:
$$ y - \frac{30}{4} = a(x - \frac{10}{4}) $$
$$ y - \frac{30}{4} = 5(x - \frac{10}{4}) $$
$$ y = 5x - 5 \cdot \frac{10}{4} + \frac{30}{4} $$
$$ y = 5x - \frac{50}{4} + \frac{30}{4} $$
$$ y = 5x + \frac{30-50}{4} $$
$$ y = 5x - \frac{20}{4} $$
$$ y = 5x - 5 $$
Therefore, the equation of the line is:
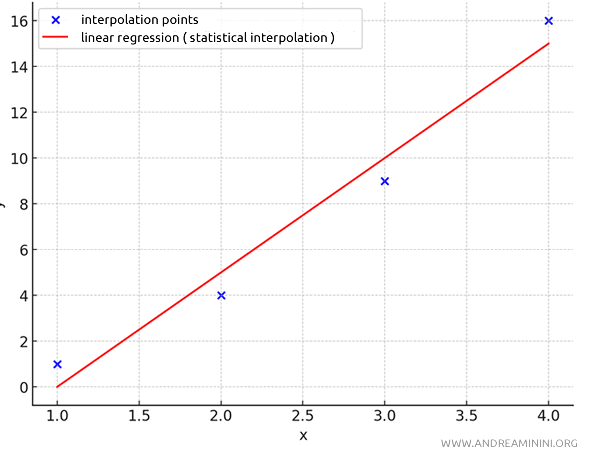
$$ y = 5x - 5 $$
This line best fits the data using the least squares method.

Note. The interpolating line \( y = 5x - 5 \) passes through the points, minimizing the distances and intersecting the point \( (\bar{x}; \bar{y}) = ( \frac{10}{4}; \frac{30}{4} ) = (2.5; 7.5) \), also known as the centroid of the distribution.
And so on.
