Linear Regression
Linear regression is a statistical method used to model the relationship between a dependent variable (the output or response) and one or more independent variables (the inputs or predictors).
In its simplest form, linear regression describes a linear relationship between variables using the equation:
$$ y = mx + c + \epsilon $$
Where:
- \( y \) is the dependent variable.
- \( x \) is the independent variable.
- \( m \) is the slope coefficient, which indicates the effect of \( x \) on \( y \).
- \( c \) is the intercept, the value of \( y \) when \( x = 0 \).
- \( \epsilon \) represents the residual error or noise, accounting for the difference between observed and predicted values.
The aim of linear regression is to estimate the values of \( m \) and \( c \) that minimize the sum of the squared differences between the observed values of \( y \) and those predicted by the model (least squares method).
Once these parameters are estimated, the equation can be used to make predictions or analyze the influence of the independent variables on the dependent variable.
The Origin of the Term "Regression": The term "regression" comes from the work of Francis Galton, a 19th-century mathematician and statistician, who observed that children’s heights tended to "regress" toward the average compared to their parents. He noted that children of very tall parents tended to be shorter, while children of very short parents were often taller. Essentially, the heights of children "regressed" toward the population’s average. Originally, "regression" referred to this tendency to return to an average value, but today it describes the statistical method used to estimate the relationship between two or more variables.
Calculating the Regression Line Equation
To calculate linear regression, I use the least squares method.
$$ y = mx + c + \epsilon $$
The objective is to find the coefficients \( c \) (intercept) and \( m \) (slope) that minimize the sum of the squared differences between the observed values (\( y_i \)) and the predicted values (\( \hat{y}_i \)).
First, I calculate the means of \( x \) and \( y \):
$$ \bar{x} = \frac{1}{n} \sum_{i=1}^{n} x_i \quad \text{and} \quad \bar{y} = \frac{1}{n} \sum_{i=1}^{n} y_i $$
Where \( n \) is the number of observations.
The slope coefficient \( m \) is calculated as follows:
$$ m = \frac{\sum_{i=1}^{n} (x_i - \bar{x})(y_i - \bar{y})}{\sum_{i=1}^{n} (x_i - \bar{x})^2} $$
This coefficient represents the line’s slope and shows how much \( y \) changes for each unit increase in \( x \).
Next, I calculate the intercept \( c \), which indicates the value of \( y \) when \( x = 0 \).
$$ c = \bar{y} - m \bar{x} $$
Thus, the regression line equation becomes:
$$ \hat{y} = mx + c $$
Where \( \hat{y} \) is the predicted value from the regression line for each value of \( x \).
A Practical Example
In this example, I’ll analyze a small dataset.
This table shows the variables \( x \) (hours studied) and \( y \) (test score):
| Hours Studied (\( x \)) | Score (\( y \)) |
|---|---|
| 1 | 2 |
| 2 | 3 |
| 4 | 5 |
| 3 | 6 |
| 5 | 8 |
I calculate the means of \( x \) and \( y \):
$$ \bar{x} = \frac{1 + 2 + 4 + 3 + 5}{5} = 3 $$
$$ \bar{y} = \frac{2 + 3 + 5 + 6 + 8}{5} = 4.8 $$
Next, I calculate the slope coefficient \( m \) using the formula:
$$ m = \frac{\sum_{i=1}^{n} (x_i - \bar{x})(y_i - \bar{y})}{\sum_{i=1}^{n} (x_i - \bar{x})^2} $$
I perform the intermediate calculations to find \( (x_i - \bar{x}) \) and \( (y_i - \bar{y}) \):
| \( x_i \) | \( y_i \) | \( x_i - \bar{x} \) | \( y_i - \bar{y} \) | \( (x_i - \bar{x})(y_i - \bar{y}) \) | \( (x_i - \bar{x})^2 \) |
|---|---|---|---|---|---|
| 1 | 2 | -2 | -2.8 | 5.6 | 4 |
| 2 | 3 | -1 | -1.8 | 1.8 | 1 |
| 4 | 5 | 1 | 0.2 | 0.2 | 1 |
| 3 | 6 | 0 | 1.2 | 0 | 0 |
| 5 | 8 | 2 | 3.2 | 6.4 | 4 |
Then, I sum the values:
$$ \sum_{i=1}^{n} (x_i - \bar{x})(y_i - \bar{y}) = 5.6 + 1.8 + 0.2 + 0 + 6.4 = 14 $$
$$ \sum_{i=1}^{n} (x_i - \bar{x})^2 = 4 + 1 + 1 + 0 + 4 = 10 $$
I substitute these results into the formula for the slope coefficient:
$$ m = \frac{14}{10} = 1.4 $$
The slope coefficient \( m \) is also known as the regression coefficient of Y on X because it shows how Y changes when X varies.
Once the slope coefficient \( m \) is found, I calculate the intercept \( c \):
$$ c = \bar{y} - m \cdot \bar{x} $$
$$ c = 4.8 - 1.4 \times 3 = 4.8 - 4.2 = 0.6 $$
Finally, I write the regression line equation using the values of \( m \) and \( c \) obtained:
$$ \hat{y } = 0.6 + 1.4x $$
This equation allows me to plot the regression line and predict the score (\( y \)) based on the number of study hours (\( x \)).
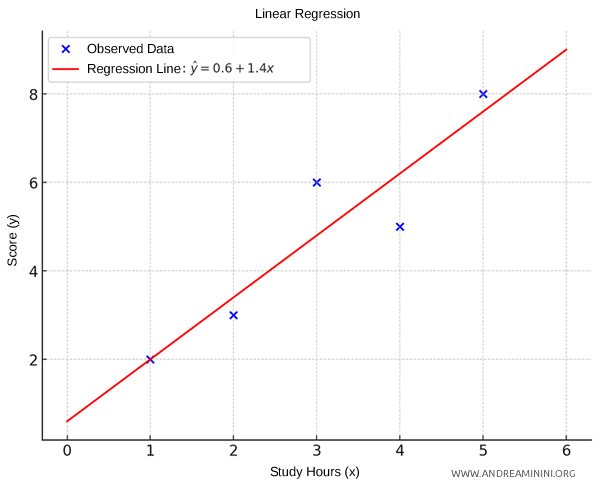
For instance, if a student studies for 4 hours, the expected score is 6.2. $$ \hat{y} = 0.6 + 1.4 \times 4 = 0.6 + 5.6 = 6.2 $$
Is There a Relationship Between Study Hours and Test Scores?
So far, I've calculated the regression line of Y with respect to X.
To verify if there’s a relationship between the variables, I also calculate the regression line of X with respect to Y using a similar method.
$$ \hat{x} = m'y + c' $$
The means of each variable remain the same:
$$ \bar{x} = \frac{1 + 2 + 4 + 3 + 5}{5} = 3 $$
$$ \bar{y} = \frac{2 + 3 + 5 + 6 + 8}{5} = 4.8 $$
The slope coefficient \( m' \) for the regression of \( X \) on \( Y \) is calculated using the formula:
$$ m' = \frac{\sum_{i=1}^{n} (y_i - \bar{y})(x_i - \bar{x})}{\sum_{i=1}^{n} (y_i - \bar{y})^2} $$
I carry out the intermediate calculations in a table:
| \( x_i \) | \( y_i \) | \( x_i - \bar{x} \) | \( y_i - \bar{y} \) | \( (y_i - \bar{y})(x_i - \bar{x}) \) | \( (y_i - \bar{y})^2 \) |
|---|---|---|---|---|---|
| 1 | 2 | -2 | -2.8 | 5.6 | 7.84 |
| 2 | 3 | -1 | -1.8 | 1.8 | 3.24 |
| 4 | 5 | 1 | 0.2 | 0.2 | 0.04 |
| 3 | 6 | 0 | 1.2 | 0 | 1.44 |
| 5 | 8 | 2 | 3.2 | 6.4 | 10.24 |
Next, I sum the calculated values:
$$ \sum_{i=1}^{n} (y_i - \bar{y})(x_i - \bar{x}) = 5.6 + 1.8 + 0.2 + 0 + 6.4 = 14 $$
$$ \sum_{i=1}^{n} (y_i - \bar{y})^2 = 7.84 + 3.24 + 0.04 + 1.44 + 10.24 = 22.8 $$
I then substitute these sums into the formula for the slope coefficient:
$$ m' = \frac{14}{22.8} \approx 0.614 $$
The slope coefficient \( m' \) is referred to as the regression coefficient of X on Y, showing how much X changes as Y varies.
The intercept \( c' \) is calculated using the following formula:
$$ c' = \bar{x} - m' \bar{y} $$
$$ c' = 3 - 0.614 \times 4.8 \approx 3 - 2.9472 \approx 0.0526 $$
With the values for \( m' \) and \( c' \), the equation for the regression line of \( X \) on \( Y \) is:
$$ \hat{x} = m'y + c' $$
$$ \hat{x} = 0.0526 + 0.614y $$
This equation allows me to estimate the values of \( x \) based on \( y \) using the observed data.
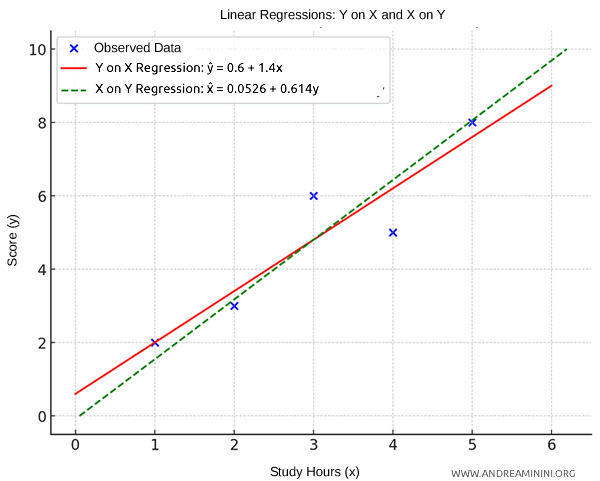
By comparing the regression line of Y with respect to X (red) and the regression line of X with respect to Y (green), I can determine if there is a linear dependency between the two variables: the study hours and test scores.
- If the angle between the two lines is small, there is a relationship between the variables. This is called a "perfect regression" when the two lines coincide, meaning the angle between them is zero.
- If the angle between the lines approaches 90° (a right angle), it indicates no linear relationship between the variables.
If the two lines are very close (especially if their slopes are nearly reciprocal), it may suggest a symmetric or almost perfect linear relationship between the variables.
In this example, the small angle between the lines indicates a linear dependency between the variables.
In other words, study hours affect test scores, and from the test score, I can infer the study hours.
And so on.


