Repeated Measurements
A repeated measurement involves taking multiple readings of the same quantity to obtain a more reliable result and minimize the effect of random errors.
By averaging repeated measurements, I can achieve a more accurate estimate of the true value of the quantity I'm measuring.
The variation range among the measurements also helps quantify the uncertainty tied to the measurement, further reducing the influence of random errors.
In other words, it’s common practice to repeat a measurement multiple times specifically to reduce uncertainty and get a closer estimate of the actual value. Often, it’s more effective to repeat the measurement than to increase the number of significant figures in a single reading, as this yields a more reliable result.
Why Use Repeated Measurements?
Individual measurements are prone to various types of errors, including:
- Random errors
These are unpredictable fluctuations caused by minor environmental changes, reading errors, or instrument variations. Such errors tend to affect each measurement differently, resulting in slight differences across readings. - Systematic errors
These are consistent errors that might arise from incorrect instrument calibration or a flawed measurement technique. While repeated measurements don’t reduce these errors, they can often be detected by comparing results with known values or using different instruments.
Repeated measurements are particularly effective at reducing the impact of random errors.
However, when using different tools, repeated measurements can also help identify potential systematic errors, which appear as consistent discrepancies due to a specific instrument.
In general, taking the average of multiple measurements offers a more reliable estimate of the true value of a quantity, while the range of measurement variation provides insight into the measurement's precision.
Even a few additional readings can give a clearer picture of the measurement’s precision.
Handling Repeated Measurements: Mean and Error
When I have a series of measurements for the same quantity, like \( x_1, x_2, \ldots, x_n \), I can calculate:
- The arithmetic mean of the recorded values
The arithmetic mean of the recorded values provides a more reliable estimate of the true value of the measured quantity \( X \) than any single reading. $$ X = \frac{x_1 + x_2 + \dots + x_n}{n} $$ - Absolute error
To estimate the absolute error, I calculate half the difference between the maximum measurement \( x_{\text{max}} \) and the minimum measurement \( x_{\text{min}} \) among the recorded values. This approach is particularly useful for estimating uncertainty when only a few measurements are available. $$ \Delta X = \frac{x_{\text{max}} - x_{\text{min}}}{2} $$Note. When dealing with a larger set of measurements, it’s preferable to calculate the standard deviation because it provides a more precise estimate of uncertainty. The standard deviation reflects how much measurements tend to spread around the mean.
A Practical Example
In this example, I measure the diameter of a sphere several times using a millimeter-graded ruler, obtaining the following values (in cm):
$$ 10.1 , 10.2 , 10.0, 10.3, 10.1 $$
I calculate the arithmetic mean of the recorded values.
$$ X = \frac{10.1 + 10.2 + 10.0 + 10.3 + 10.1}{5} = \frac{50.7}{5} = 10.14 \ \text{cm} $$
Thus, the estimated mean value is $ X = 10.14 \ \text{cm} $
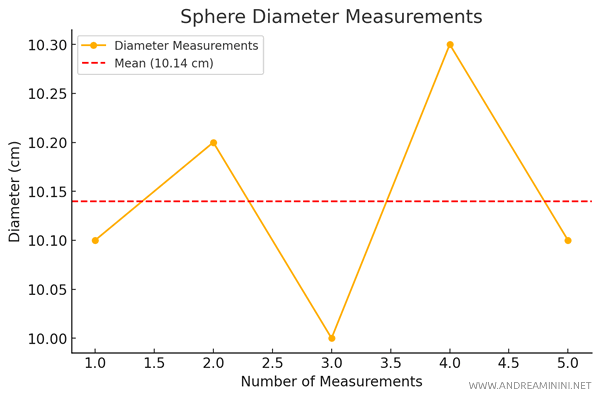
To calculate the absolute error, I identify the maximum and minimum values in the series:
$$ x_{\text{max}} = 10.3 $$
$$ x_{\text{min}} = 10.0 $$
Then I calculate the average between these two values:
$$ \Delta X = \frac{10.3 - 10.0}{2} = \frac{0.3}{2} = 0.15 \ \text{cm} $$
Therefore, the absolute error is $ 0.15 \ \text{cm} $
In conclusion, I can express the final measurement of the diameter as:
$$ X = 10.14 \pm 0.15 \ \text{cm} $$
Averaging repeated measurements reduces the effect of random errors and enhances the accuracy of the result.
And so on.


