Analyzing the Sign of a Function
Within a given interval, a function is said to be positive if f(x) > 0, negative if f(x) < 0, and zero if f(x) = 0.

To determine where a function is positive or negative, we identify the points where its graph intersects the x-axis - these are known as the zeros of the function.
Note. The sign analysis is part of the broader function study, which describes key features such as domain, intervals of increase and decrease, concavity and convexity, local extrema, inflection points, and more.
A Concrete Example
Consider the function defined over the set of real numbers:
$$ y = x^3 - 2x^2 - 3x $$
Its domain is the entire real line: (-∞, +∞).
To find its x-intercepts (i.e., its zeros), we solve for y = 0:
$$ x^3 - 2x^2 - 3x = 0 $$
Factoring out x gives:
$$ x(x^2 - 2x - 3) = 0 $$
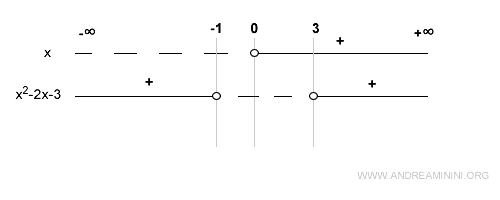
We now analyze the sign of each factor: x and the quadratic expression x2 - 2x - 3.
The sign of the first factor (x) is straightforward - it’s positive when x > 0.
This is shown using a solid line for the positive region, and an open circle to mark the zero at x = 0.

The second factor is a quadratic equation. Applying the quadratic formula:
$$ x = \frac{-b \pm \sqrt{b^2 - 4ac}}{2a} $$ $$ x = \frac{-(-2) \pm \sqrt{(-2)^2 - 4(1 \cdot -3)}}{2(1)} $$ $$ x = \frac{2 \pm \sqrt{16}}{2} $$ $$ x = \frac{2 \pm 4}{2} $$
This gives the roots:
$$ x_1 = \frac{2 + 4}{2} = 3 \quad \text{and} \quad x_2 = \frac{2 - 4}{2} = -1 $$
Next, we analyze the sign of the quadratic between and beyond these roots:
- In the interval (-1, 3), the quadratic is negative. For instance, at x = 0, f(x) < 0.
- In the interval (-∞, -1), it is positive. For example, x = -2 yields f(x) = 5.
- In the interval (3, +∞), it remains positive. For example, x = 4 gives f(x) = 5.
These sign intervals and roots are plotted on a sign chart:
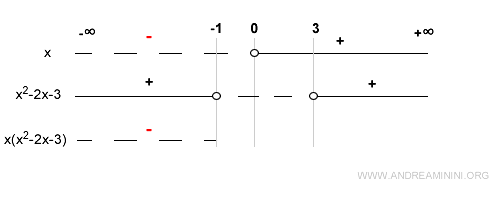
Since the original function is the product of x and (x2 - 2x - 3), we now determine the sign of the function by combining the signs of both factors.
For example, in the interval (-∞, -1), x is negative and the quadratic is positive.
Thus, their product is negative:
At x = -1, the quadratic is zero, so the product is also zero:

In the interval (-1, 0), both factors are negative, so their product is positive:
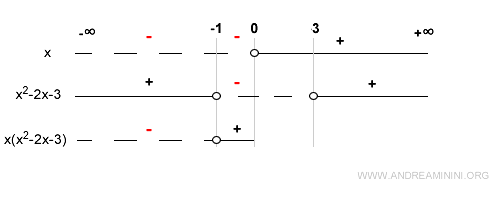
At x = 0, the first factor is zero, making the function zero as well - this is another root:
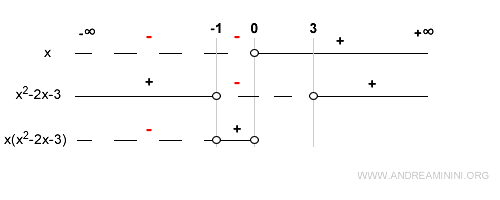
In the interval (0, 3), x is positive and the quadratic is negative, so the product is negative - f(x) is negative here:

At x = 3, the quadratic becomes zero again, so the function is zero - a third root:
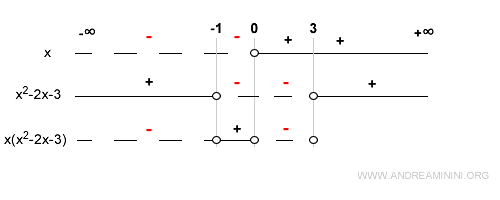
Finally, in the interval (3, +∞), both factors are positive, and so is their product - f(x) is positive:
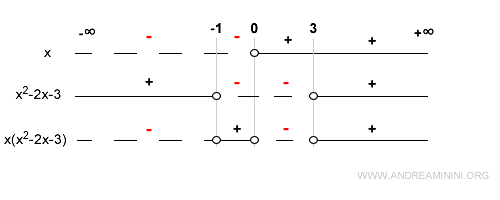
This final line summarizes where the function f(x) = x(x2 - 2x - 3) is positive or negative and highlights its zeros.
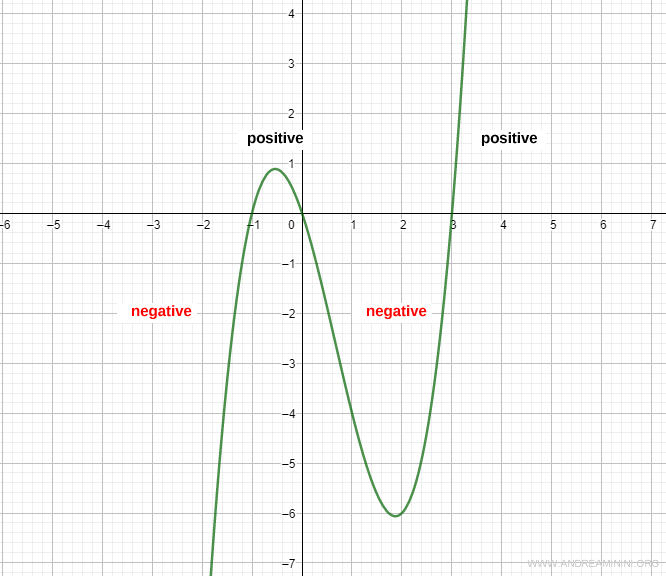
In summary: the function is negative from - ∞ to - 1, positive from - 1 to 0, negative from 0 to 3, and positive from 3 to ∞.
Here’s the graph of the function to visually confirm the analysis:
And so on.
