Numerical Functions
A function is called a numerical function when both its domain and codomain consist of numerical sets.
The rule that defines the function is referred to as its analytic expression.
For example:
$$ y = f(x) = 2x+1 $$
The analytic expression of the function f(x) is y = 2x + 1.
Here, we are dealing with a function of a single variable.
- The variable y is known as the dependent variable because its value "depends" on the value of x.
- The variable x is known as the independent variable because its value "does not depend" on any other variable.
The set of all possible values that the independent variable (x) can take is called the domain, natural domain, or domain of definition of the function.
Conversely, the set of values that the dependent variable (y) can assume is called the codomain.
A Practical Example
Let's examine the function:
$$ y = \frac{x+1}{x} $$
The domain of this function consists of all real numbers except zero:
$$ D_f = \mathbb{R} \setminus \{ 0 \} $$
Zero is excluded from the domain because the function is undefined at x = 0 - division by zero is not permitted.
Thus, the independent variable can take any real value in the intervals (-∞, 0) ∪ (0, ∞).
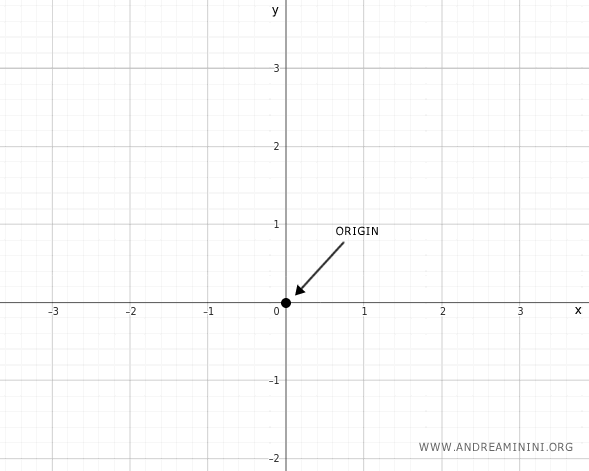
To graph the function, we begin by constructing a Cartesian diagram.
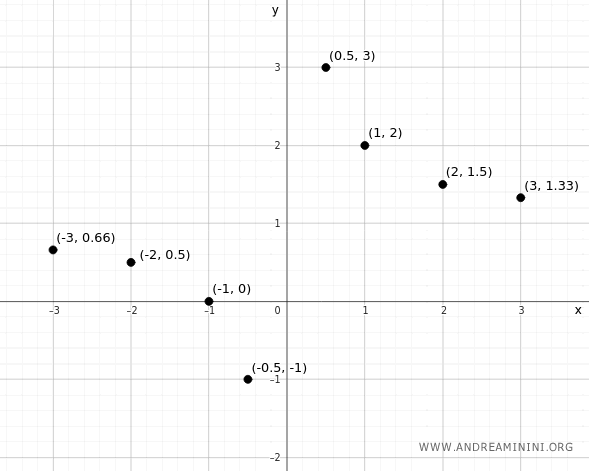
We start by creating a table that pairs selected x-values with their corresponding y-values. Each row of the table represents an ordered pair (x, y).
$$ \begin{array}{c|c} x & y \\ \hline -3 & 0.66 \\ -2 & 0.5 \\ -1 & 0 \\ -0.5 & -1 \\ 0 & \text{undefined} \\ 0.5 & 3 \\ 1 & 2 \\ 2 & 1.5 \\ 3 & 1.33 \end{array} $$
Next, we plot a Cartesian diagram, placing the domain (x) along the horizontal x-axis and the codomain (y) along the vertical y-axis.
We also establish an orientation and a unit of measurement for each axis.

The point where the two axes intersect is called the origin O, corresponding to the ordered pair (0, 0).
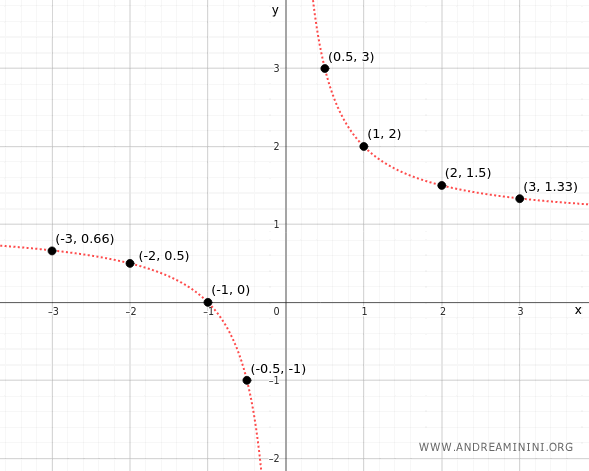
We then plot on the coordinate plane the points representing the ordered pairs (x, y) from the table.

The collection of all these points forms the graph of the function.

And so forth.
