Sample Space in Probability
The sample space is the set of all possible outcomes of an experiment. It’s usually denoted as S or Ω (omega).
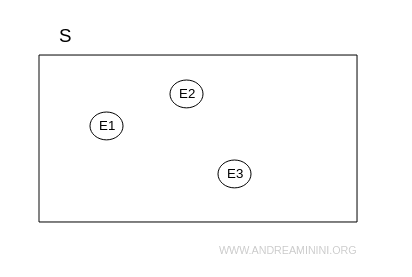
In Venn diagrams, the sample space is depicted as a rectangle.
The outcomes are represented by circles.

Example
When rolling a die, the sample space includes 6 possible outcomes:
$$ S = \{ 1, 2, 3, 4, 5, 6 \} $$
Subsets of the sample space are called events.
An event E is a subset of the sample space (E⊂S), consisting of certain possible outcomes.
Example
In a die roll, one possible event E is getting an even number:
$$ E = \{ 2, 4, 6 \} $$
Another event F could be rolling an odd number:
$$ F = \{ 1, 3, 5 \} $$
This can be illustrated using a Venn diagram:

Both events are subsets of the sample space S = {1, 2, 3, 4, 5, 6}.
$$ E ⊂ S $$
$$ F ⊂ S $$
And so on.
