Visualizing a Function of Two Variables
To graph a function of two variables, such as f(x, y), in three-dimensional space, consider the following example:
$$ z = f(x, y) = x^2 + y^2 $$
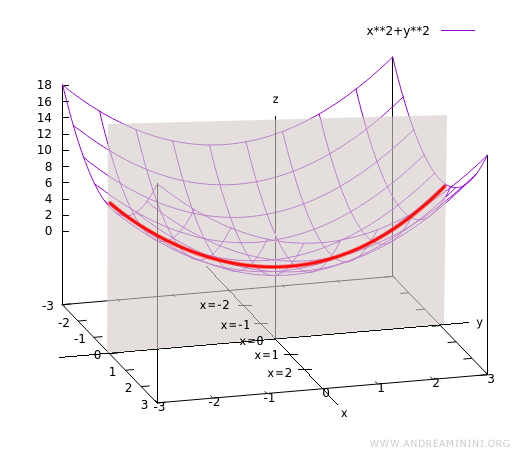
Start by setting y = 0 and examine how the function behaves as x varies:
$$ z = f(x, 0) = x^2 $$
This produces a parabolic curve in the xz-plane:
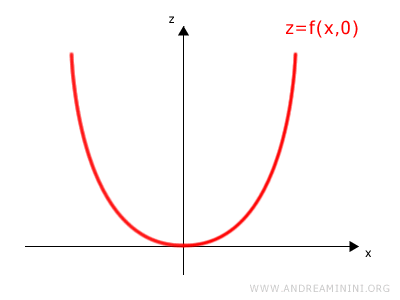
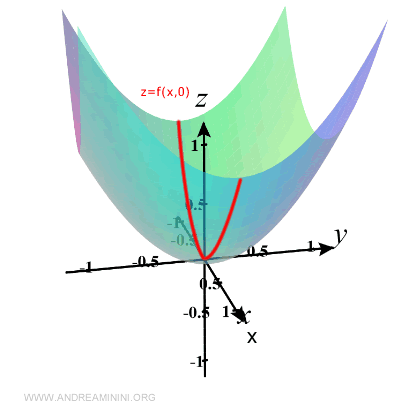
This curve represents the trace of the surface z = f(x, y) when y is fixed at zero.
Geometrically, it lies entirely within the xz-plane where y = 0:
Next, set x = 0 and observe the variation of the function as y changes:
$$ z = f(0, y) = y^2 $$
This gives another parabolic curve, this time lying in the yz-plane:
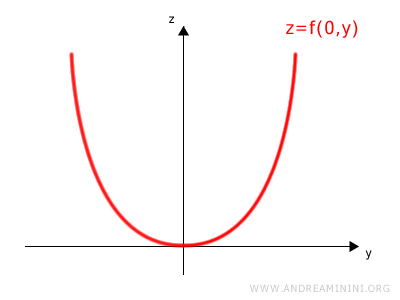
This trace corresponds to the case where x is held constant at zero.
Again, geometrically, the curve lies in the yz-plane along x = 0:
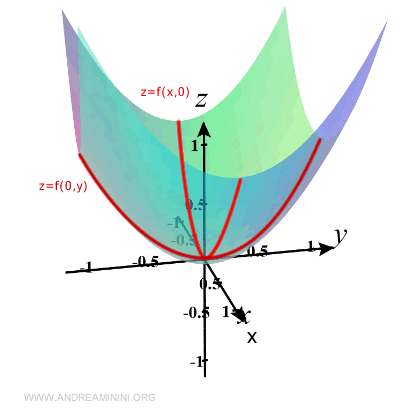
Repeating this procedure for other constant values of x and y reveals the local behavior of the surface.
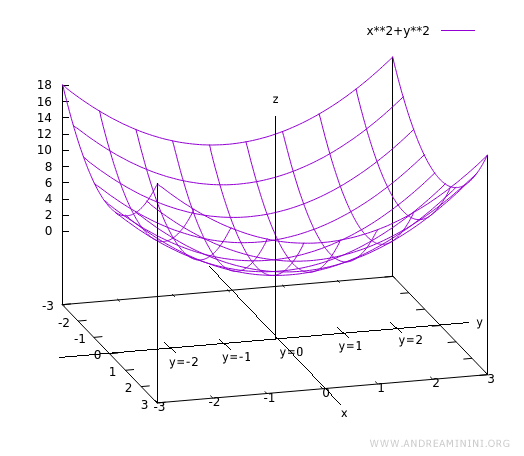
The resulting picture is a local representation of the function in 3D:
Note. When we evaluate the function along lines where y is held constant - say, f(x, y = 1) - we obtain new curves in the xz-plane. These curves do not overlap because each corresponds to a different fixed value of y. The xz-plane intersects the y-axis orthogonally at y = 1, y = 2, and so on.
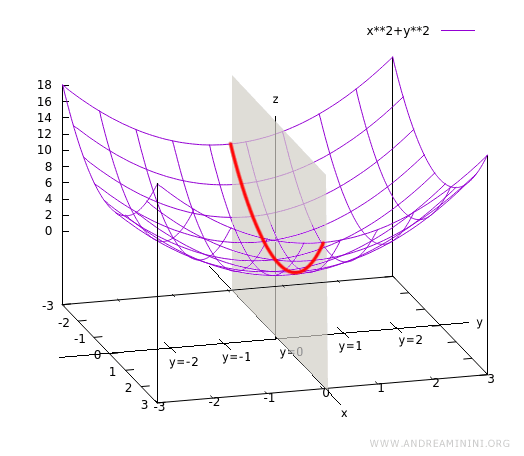
Similarly, the function can be examined along yz-planes for fixed x-values. Each yz-plane intersects the x-axis at a different location - x = 1, x = 2, etc. - yielding a family of curves in the yz-direction as well.
These traces can also be described parametrically, which offers an alternative and often more general way of representing them:
Along the x-axis direction:
$$ \begin{pmatrix} x \\ y \end{pmatrix} = \begin{pmatrix} 0 \\ 0 \end{pmatrix} + t \cdot \begin{pmatrix} 1 \\ 0 \end{pmatrix} $$
Along the y-axis direction:
$$ \begin{pmatrix} x \\ y \end{pmatrix} = \begin{pmatrix} 0 \\ 0 \end{pmatrix} + t \cdot \begin{pmatrix} 0 \\ 1 \end{pmatrix} $$
For instance, to examine the curve in the xz-plane that intersects the y-axis at y = 1, we can use the parametric representation:
$$ \begin{pmatrix} x \\ y \end{pmatrix} = \begin{pmatrix} 0 \\ 1 \end{pmatrix} + t \cdot \begin{pmatrix} 1 \\ 0 \end{pmatrix} $$
Given the original function:
$$ z = x^2 + y^2 $$
Substituting y = 1 yields:
$$ z = x^2 + 1 $$
And similarly for other values of y.
