Graph of the Functions of Two or More Variables
What Are Multivariable Functions?
Functions of two or more variables involve multiple independent inputs. $$ f:R^n \rightarrow R $$
The output can be a single real value (R), an ordered pair (R2), or an m-tuple of real values (Rm).
$$ f:R^n \rightarrow R^m $$
Illustrative Examples
Example 1
Consider a function of two real variables:
$$ f:R^2 \rightarrow R $$
One such example is:
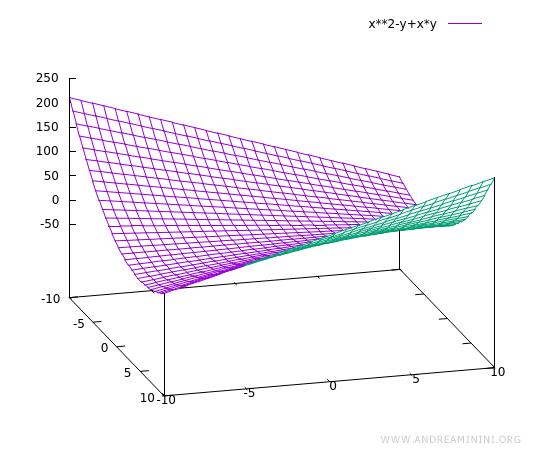
$$ f(x,y) = x^2 - y + xy $$
Note. The independent variables can also be written as components of a vector, with \( x_1 \) and \( x_2 \) representing the first and second components respectively: $$ f(x_1,x_2) = x_1^2 - x_2 + x_1 x_2 $$
Below is the graph of the function in three-dimensional space, with axes x, y, and f(x, y):

Example 2
Another function of two real variables:
$$ f:R^2 \rightarrow R $$
is defined as:
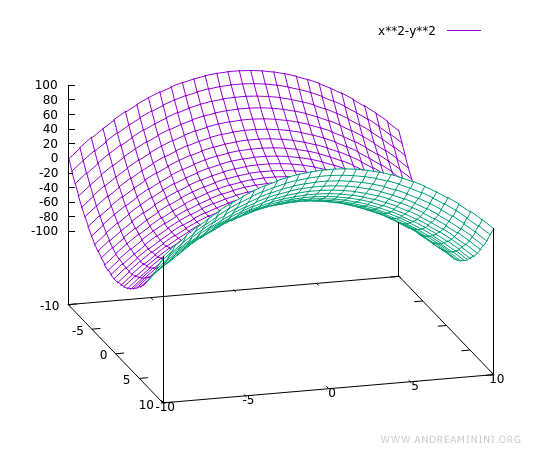
$$ f(x,y) = x^2 - y^2 $$
Here is its graph in the three-dimensional space (x, y, f(x, y)):

Example 3
Now consider a function of three real variables:
$$ f:R^3 \rightarrow R $$
defined as:
$$ f(x,y,z) = x^2 + z^2 + yz $$
Note. A function may be defined over multiple variables without necessarily using all of them in its expression. For instance, the function below is still a function of three variables, even though only x and y appear explicitly: $$ f(x,y,z) = x^2 + y^2 $$
In this case, the graph cannot be visualized, as it resides in four-dimensional space: x, y, z, and f(x, y, z).
The Graph of a Function of Two Variables
The graph of a function \( f:A \rightarrow \mathbb{R} \), where \( A \subseteq \mathbb{R}^2 \), is the set of all points \( (x, y, z) \in \mathbb{R}^3 \) such that \( (x, y) \) lies in the domain \( D_f \), and \( z = f(x, y) \).
$$ \text{graph} = \{ (x, y, z) \in \mathbb{R}^3 \mid (x, y) \in D_f, \ z = f(x, y) \} $$
Here, \( \mathbb{R}^3 \) is the Cartesian product \( \mathbb{R} \times \mathbb{R} \times \mathbb{R} \) of the variables x, y, and z.
Note. For a function of a single variable, the graph is a curve in the plane: $$ \text{graph} = \{ (x, y) \in \mathbb{R}^2 \mid x \in D_f, \ y = f(x) \} $$ For a function of two variables, \( z = f(x, y) \), the graph becomes a surface in three-dimensional space: $$ \text{graph} = \{ (x, y, z) \in \mathbb{R}^3 \mid (x, y) \in D_f, \ z = f(x, y) \} $$
In general, the graph of a function of \( n \) variables is a subset of \( \mathbb{R}^{n+1} \) and is defined as follows:
$$ \text{graph} = \{ (\vec{x}, y) \in \mathbb{R}^{n+1} \mid \vec{x} \in D_f, \ y = f(\vec{x}) \} $$
Here, \( \vec{x} \) is a vector with \( n \) components, and \( y \) is a real number.
$$ \vec{x} = (x_1, x_2, \ldots, x_n) $$
Note. This notation closely mirrors the one-variable case, \( y = f(x) \), where \( x \) is a real number: $$ \text{graph} = \{ (x, y) \in \mathbb{R}^2 \mid x \in D_f, \ y = f(x) \} $$ In a multivariable context, however, \( x \) becomes a vector in \( \mathbb{R}^n \): $$ \text{graph} = \{ (\vec{x}, y) \in \mathbb{R}^{n+1} \mid \vec{x} \in D_f, \ y = f(\vec{x}) \} $$
And so on.
