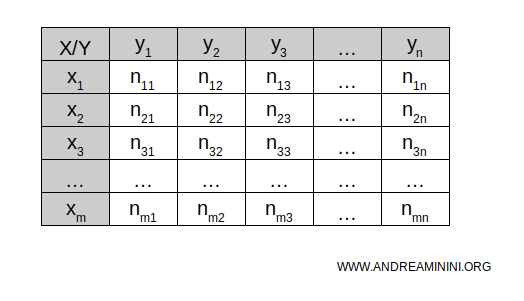
Double-Entry Tables
Double-entry tables (also known as crosstab or cross tabulation) are tools used to illustrate the relationship between two statistical variables, X and Y.
These tables are particularly valuable for representing a joint or bivariate distribution (X,Y), where both variables are observed simultaneously in each statistical unit. They allow for a clear visualization of the interactions between the two variables.
They’re termed "double-entry" because they combine information from two dimensions or variables, enabling a detailed examination of their relationship.
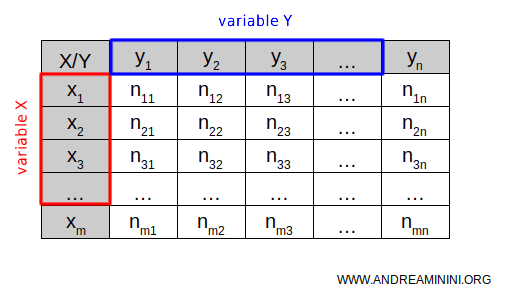
The rows of the table represent the categories or values of the first variable, X, while the columns show the categories or values of the second variable, Y.
In each cell of the table, the absolute or relative frequency (njk) of the statistical units that exhibit the same categories of both X and Y is recorded.
These frequencies within the table are also known as joint or internal frequencies.
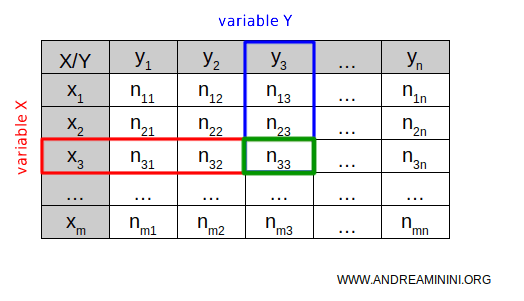
Through this, the double-entry table allows us to observe two distinct characteristics of the same statistical units.
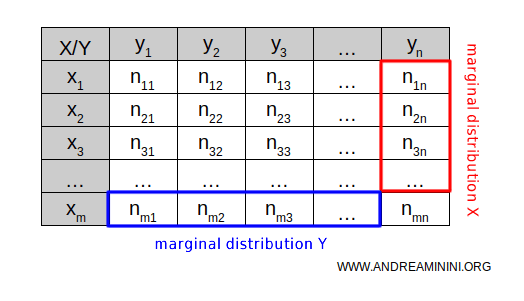
The totals in a double-entry table are referred to as marginal frequencies and give rise to marginal distributions, which are distributions that consider only one variable, independently of the other.
Note: If both variables are quantitative, double-entry tables are called correlation tables or pivot tables. If they are qualitative, they are referred to as contingency tables. When one variable is quantitative and the other is qualitative, they are known as mixed tables.
A Practical Example
Let's consider two datasets that record the grades of students in a class.
The first dataset shows the grades in literature, while the second lists the math grades for each student in the class.
| Students | Literature | Math |
|---|---|---|
| Alexander | 7 | 6 |
| Alice | 8 | 7 |
| Andrew | 6 | 8 |
| Beatrice | 5 | 8 |
| Clara | 8 | 8 |
| David | 9 | 7 |
| Elise | 6 | 7 |
| Frederica | 9 | 8 |
| Frances | 9 | 7 |
| Gaia | 7 | 6 |
| John | 7 | 8 |
| Julia | 9 | 6 |
| Irene | 8 | 5 |
| Luke | 7 | 6 |
| Mark | 5 | 6 |
| Martina | 7 | 5 |
| Matthew | 6 | 8 |
| Sarah | 6 | 6 |
| Simon | 5 | 6 |
| Valentina | 6 | 6 |
Note: In this example, the population consists of 20 students in a class. Each student represents a statistical unit. There are two variables: literature and math grades, with the grades ranging from 1 to 10 representing the values of these variables.
I represent the literature grades in the columns of the double-entry table and the math grades in the rows.
| LITERATURE | |||||||
|---|---|---|---|---|---|---|---|
| MATH | 5 | 6 | 7 | 8 | 9 | Total | |
| 5 | |||||||
| 6 | |||||||
| 7 | |||||||
| 8 | |||||||
| Total | |||||||
In each cell of the table, I record the absolute frequencies, indicating how many students received a specific combination of grades in both literature and math.
| LITERATURE | |||||||
|---|---|---|---|---|---|---|---|
| MATH | 5 | 6 | 7 | 8 | 9 | Total | |
| 5 | 1 | 1 | 2 | ||||
| 6 | 3 | 2 | 3 | 1 | 9 | ||
| 7 | 1 | 1 | 2 | 4 | |||
| 8 | 2 | 1 | 1 | 1 | 5 | ||
| Total | 3 | 5 | 5 | 3 | 4 | 20 | |
The final result is a representation of the correlation between the two variables.
At a glance, this table allows us to see how many students received specific grades in both literature and math.
Note: The first column, showing the math grades, and the last column represent the marginal distribution of math grades for all students. Similarly, the first row, with the literature grades, and the last row display the marginal distribution of literature grades for the entire population.
Each column or row represents the conditional distribution of one variable based on a specific value of the other.
For example, by focusing on the second-to-last column, we can observe the conditional distribution of math grades among students who scored 8 in literature.
| LITERATURE | |||||||
|---|---|---|---|---|---|---|---|
| MATH | 5 | 6 | 7 | 8 | 9 | Total | |
| 5 | 1 | 1 | 2 | ||||
| 6 | 3 | 2 | 3 | 1 | 9 | ||
| 7 | 1 | 1 | 2 | 4 | |||
| 8 | 2 | 1 | 1 | 1 | 5 | ||
| Total | 3 | 5 | 5 | 3 | 4 | 20 | |
Conditional distributions are also useful for calculating relative frequencies in relation to a marginal distribution.
This is particularly valuable for assessing whether the two variables are independent or dependent.
For example, I calculate the relative frequencies of the conditional distributions of math grades by dividing each absolute frequency by the column total.
| LITERATURE | |||||||
|---|---|---|---|---|---|---|---|
| MATH | 5 | 6 | 7 | 8 | 9 | Total | |
| 5 | 1/5 | 1/3 | 2/20 | ||||
| 6 | 3/3 | 2/5 | 3/5 | 1/4 | 9/20 | ||
| 7 | 1/5 | 1/3 | 2/4 | 4/20 | |||
| 8 | 2/5 | 1/5 | 1/3 | 1/4 | 5/20 | ||
| Total | 3/3 | 5/5 | 5/5 | 3/3 | 4/4 | 20/20 | |
In this way, I obtain the relative frequencies.
| LITERATURE | |||||||
|---|---|---|---|---|---|---|---|
| MATH | 5 | 6 | 7 | 8 | 9 | Total | |
| 5 | 0.2 | 0.33 | 0.1 | ||||
| 6 | 1 | 0.4 | 0.6 | 0.25 | 0.45 | ||
| 7 | 0.2 | 0.33 | 0.5 | 0.2 | |||
| 8 | 0.4 | 0.2 | 0.33 | 0.25 | 0.25 | ||
| Total | 1 | 1 | 1 | 1 | 1 | 1 | |
When the final column of totals (marginal distribution) matches the distributions in the previous columns (conditional distributions), the two variables are independent.
In this case, the sequences of relative frequencies differ, indicating that the two variables are somewhat dependent.
An Alternative Method to Verify Independence
Alternatively, to verify the independence of the variables, I can calculate the relative frequencies relative to the total population of 20.
| LITERATURE | |||||||
|---|---|---|---|---|---|---|---|
| MATH | 5 | 6 | 7 | 8 | 9 | Total | |
| 5 | 1/20 | 1/20 | 2/20 | ||||
| 6 | 3/20 | 2/20 | 3/20 | 1/20 | 9/20 | ||
| 7 | 1/20 | 1/20 | 2/20 | 4/20 | |||
| 8 | 2/20 | 1/20 | 1/20 | 1/20 | 5/20 | ||
| Total | 3/20 | 5/20 | 5/20 | 3/20 | 4/20 | 20/20 | |
The two variables are independent when the joint relative frequencies are the product of the marginal relative frequencies.
| LITERATURE | |||||||
|---|---|---|---|---|---|---|---|
| MATH | 5 | 6 | 7 | 8 | 9 | Total | |
| 5 | 0.05 | 0.05 | 0.1 | ||||
| 6 | 0.15 | 0.1 | 0.15 | 0.05 | 0.45 | ||
| 7 | 0.05 | 0.05 | 0.1 | 0.2 | |||
| 8 | 0.1 | 0.05 | 0.05 | 0.05 | 0.25 | ||
| Total | 0.15 | 0.4 | 0.4 | 0.15 | 0.2 | 1 | |
In this case, the joint relative frequencies do not equal the product of the marginal relative frequencies, indicating that the two variables are dependent.
For example, if we look at the joint relative frequency of 0.1 for students who scored 6 in both math and literature, the product of the respective marginal relative frequencies is 0.4 x 0.45 = 0.18, which differs from 0.1.
Example 2
This table shows the results of a survey conducted among 100 people to examine the relationship between education level (low, medium, high) and movie genre preference (comedy, action, drama).
The table might look like this:
| Education Level | Comedy | Action | Drama |
|---|---|---|---|
| Low | 10 | 15 | 5 |
| Medium | 20 | 10 | 10 |
| High | 5 | 15 | 10 |
For example, this table shows that among people with a medium education level, 20 prefer comedy films.
In this case, both variables (education level and movie genre) are qualitative, making this a contingency table.
And so on.


